
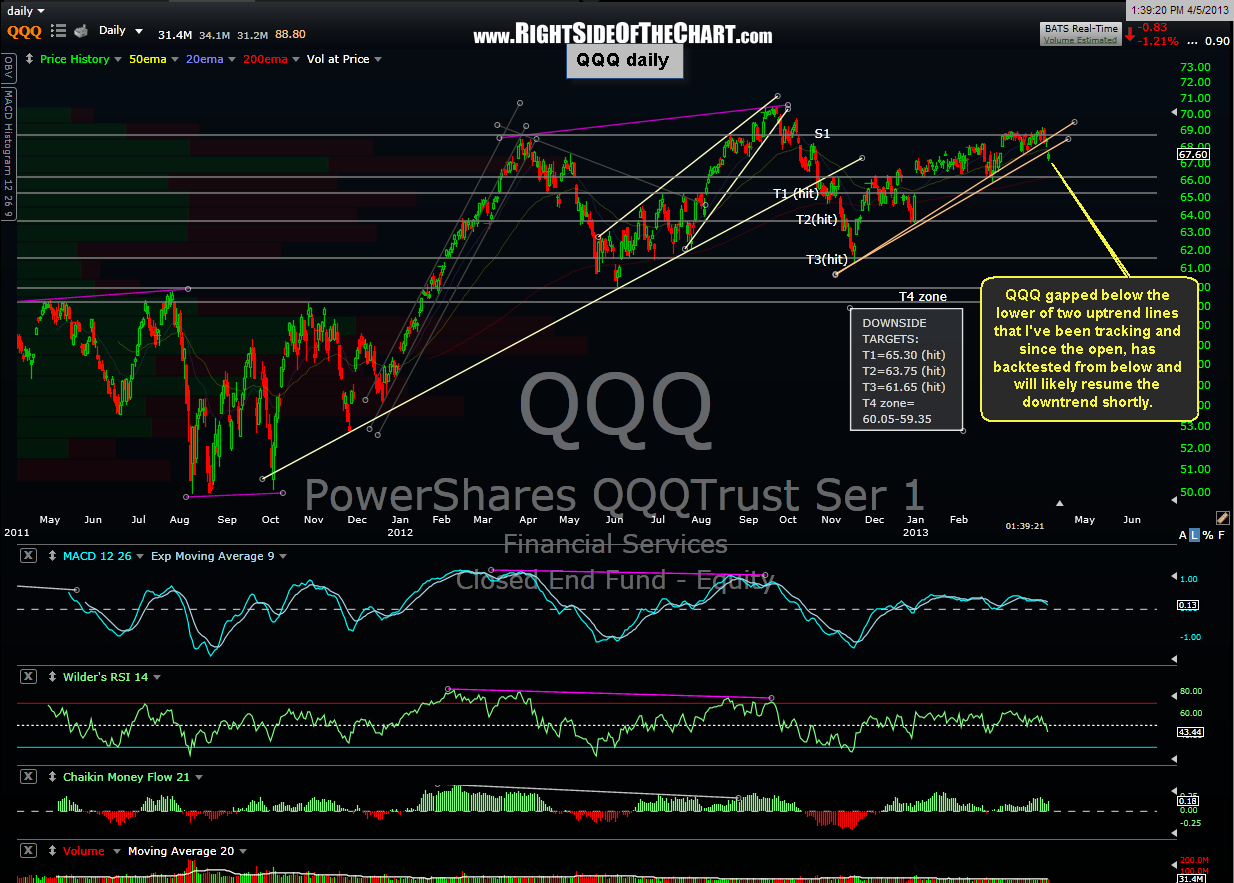
Here’s the updated 15 minute chart of IWM, which shows prices currently backtesting the bear flag pattern. Zooming out to the bigger picture, the SPY is still backtesting the upper wedge line that it also gapped below today (as shown in the previous chart). As this QQQ daily chart shows, that key index also gapped below an important trendline today and has so far failed to reclaim it on the failed attempt earlier today. In summary, these key indices are all trying to regain important resistance (previous support) levels here so what happens during the next 2 hours of trading could likely set the tone for how the markets follow thru next week and possibly beyond. If prices were to turn down impulsively (my preferred scenario), that selling would likely carry forward into next week. If these indexes can solidly regain these key level, that would be a potentially bullish event but would need additional follow thru to the upside next week to confirm. Updated IWM 15 minute chart followed by the QQQ daily time frame.

On an admin note: My apologies to those signed up to receive automated post notifications via email on the duplicate emails sent out earlier today. I have ask my programmer to look into the issue and hope to have the problem resolved asap. Until then, I have suppressed the auto-notification feature so best to check the site periodically for any updates until you receive email notification that the issue has been resolved.