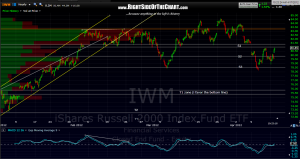
remember, once support is broken it becomes resistance. i’ve posted several charts of the SPY and QQQ yesterday and those overhead levels are still valid. here’s the updated IWM 60 minute chart. as you can see, prices held and bounced around S3 but now face some significant resistance not too far overhead. S1 was the former support level and is now a key resistance zone that i will be watching.
as far as AAPL, so far it has held S1 and has moved a little higher but so far, not very convincingly. of course, things can change so i will continue to monitor but for now, the near-term trend remains lower and until the overhead resistance on all the key indexes is taken out, my preference is to sell or short bounces and buy/cover on support (partial positions that is, to micro-manage the core swing shorts).


