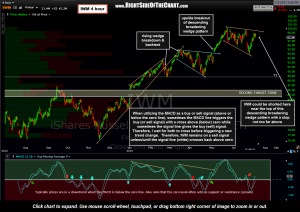
 A follower of the site asked my opinion regarding a short entry on IWM here. My thoughts are detailed in this 4-hour period chart but to summarize, I do think IWM offers an objective short entry at current levels with a stop not too far above this most recent descending broadening wedge pattern. Like many price patterns, descending broadening wedges can break either way and the direction of the breakout (up or down) will likely determine the next significant trend in the security.
On this 4-hour period chart, we can see three distinct price patterns: 1) A bearish rising wedge pattern, which broke down, backtested, & then prices fell to support while setting up in a… 2) descending broadening wedge pattern. That pattern then broke to the upside, triggering a buy signal which was also confirmed via a bullish zero-line cross in the MACD. Prices have once again set up within… 3) another descending broadening wedge pattern and as the MACD remains on a sell signal, I am leaning towards a downside resolution of this pattern.
Even if I am wrong and we get an upside resolution (breakout) of this current pattern, from a simple R/R perspective, shorting IWM here near the top of the pattern (i.e.-resistance) with a stop not too far above that upper-most downtrend line still offers an objective short entry since the loss potential if my analysis is wrong is far outweighed by the profit potential if correct. In fact, since I don’t have any broad market etf’s currently listed as active short trades on the site, I’m going to go ahead an add IWM as a short entry here around currently levels (97.94). Target levels are shown on this chart but I will follow up with the specific suggested target levels soon.

