this week’s economic calendar contains quite a few potentially market moving releases. as anyone watching the markets this morning noted, prices jumped sharply at 10:00 ET immediately following the release of the ISM manufacturing index report, which came in above expectations. i won’t try to spin a bullish ISM beat as bearish although i do want to reiterate that traders should not read too much any one single data point, as week-to-week and month-to-month economic data releases tend to fluctuate rather sharply. i highly recommend focusing on the overall trend of the economic data and not putting too much stock into any single data point. just like charting stocks and stock market indices, it helps to identify and monitor trends on various time frames, particularly the short-term, intermediate-term and long-term trends. trend identification, like many other aspects of both technical and fundamental analysis can be highly subjective, hence the reason for the invariable difference of opinions between bulls and bears. when i look at the ISM manufacturing index chart, here’s what i see:
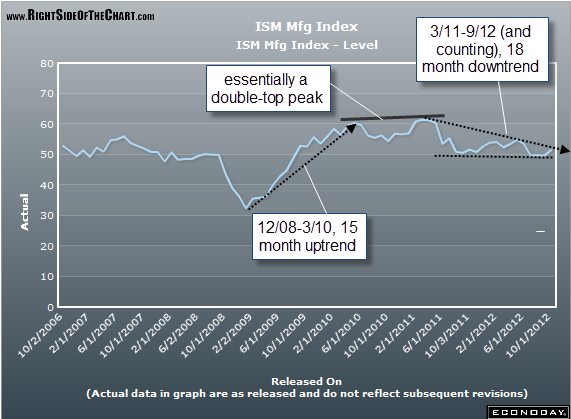
- from a longer-term perspective, i see the index clearly bottoming in december 2008 and then peaking 15 months later in march 2010.
- the index then went on to roughly trade sideways until late 2010, early 2011, making only marginal new highs and effectively putting in a double-top (roughly equal peaks) over that time.
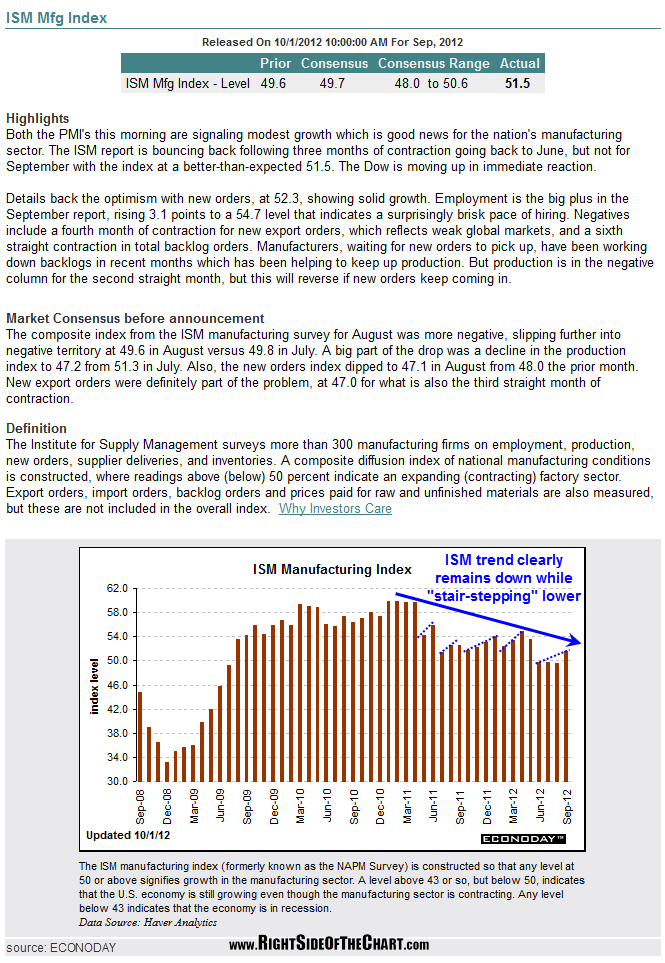
- since early 2011, the index has clearly been trending lower and appears to be bounded by a downtrend line from above and horizontal support from below (a near double bottom from the two trough lows). taken together, those support and resistance levels make up what could be interpreted as a descending triangle pattern (shown on the 2nd chart below).
as that descending triangle pattern is approaching the apex, a resolution is bound to happen sooner than later and whether the index breaks above or below the pattern could help indicate the direction of the future trend. coincidentally (or not so much really), the double-bottom on that pattern is the 50 level on the ISM index. readings above 50 indicate expansion in the manufacturing sector while readings below 50 indicate contraction, which typically occurs during recessions.
finally, as noted on the first chart below, today’s 51.5 reading, there seems to be a fairly clear pattern of “stair-stepping” lower within the current downtrend. in other words,while the overall trend on the ISM has been unmistakably lower since early 2011, the month-to-month data sets tend to ratchet up for 2 to 4 months and then suddenly drop lower than the preceding low (a new lower low). it seems that today’s above expectation “beat”, which was met with gleeful exuberance from the bulls (and/or flightly bears covering their shorts, as evidenced from the strong surge of buying following the release), is very much inline with that pattern which has been in place for the last year and a half.