
EIS (iShares MSCI Isreal Capped Investable Market Index Fund ETF) has a very clear history of very sharp uptrends followed by very sharp downtrends with very few & brief periods of sideways consolidation, unlike most global ETFs. For whatever reasons, this Isreali stock market proxy is usually either in strong rally mode or impulsive correction mode & those trends are almost always marked by fairly well-defined trendlines.
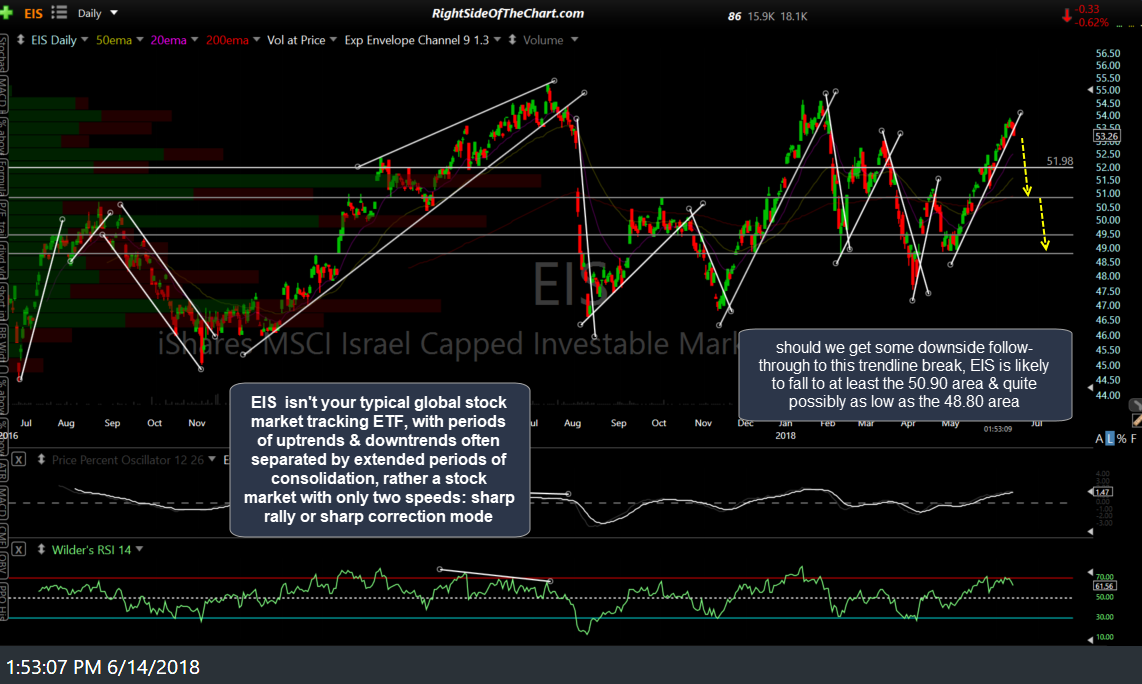
EIS daily June 14th
While there is still a bit more work to do in order to firm up a sell signal following today’s slight break below the current uptrend line, should EIS continue much lower, odds are that the sharp uptrend off the early May lows will be over with a new downtrend underway. Just glancing at the chart above, it appears that the corrections following the previous rallies ranged from about 80% to over 100% of the previous uptrend.
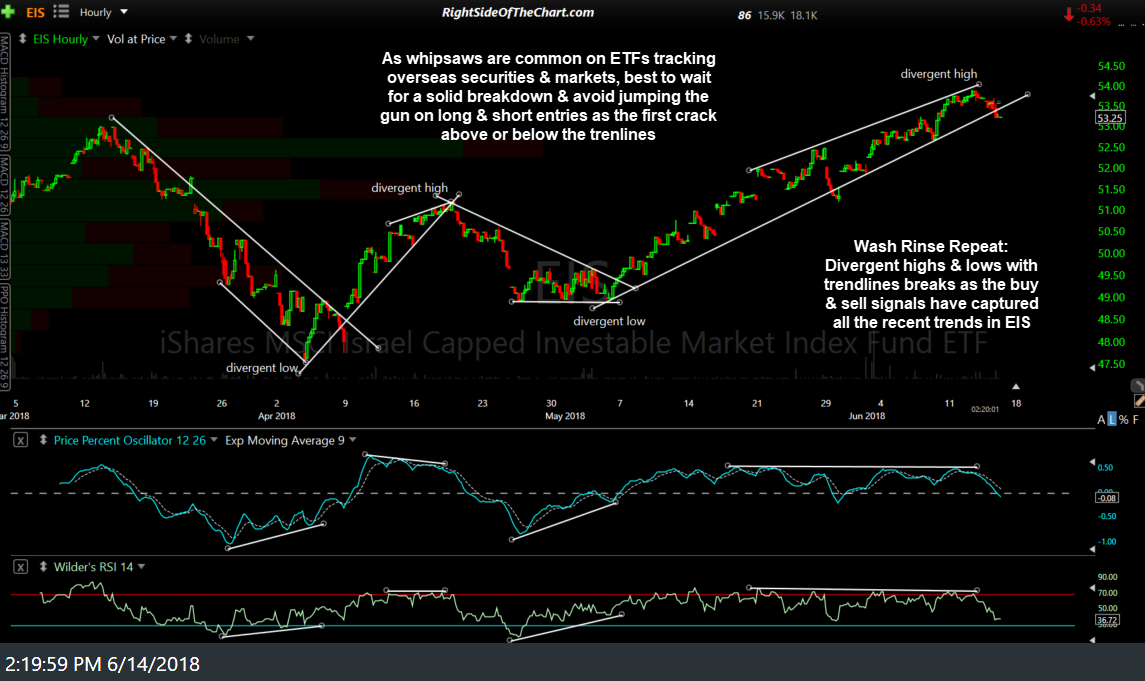
EIS 60-min June 14th
The 60-minute chart above zeros in on the current uptrend line. As with any overseas global ETF, in which the markets are trading during the overnight session while the US markets are closed, opening gaps & whipsaw signals are more the norm than the exception so best to not jump the gun on the first sign of a trendline break.
As the current trend in the US markets is still bullish without any solid sell signals at this time, I’m just passing this one along as an unofficial trade setup for now as well as an FYI for those long EIS. While the Isreali stock market isn’t highly correlated with the US stock market, most developed countries tend to move roughly in concert with the US so a short on EIS could face some headwinds until & unless the US market starts to move lower.