
Over the years I’ve found that when a stock has a clearly bullish or bearish technical posture heading into earnings, the next trend in the stock is often (although not always) indicated by the charts whereas holding a stock without clearly bullish or bearish technicals is a crap shoot. In the case of INTC (Intel Corp.), which is scheduled to report earnings after the market close tomorrow (along with 4 other of the largest components of the Nasdaq 100; AMZN, MSFT, GOOG & GILD), the charts indicate that the odds favor a correction down to any or all of the support levels shown on the 60-minute chart below.
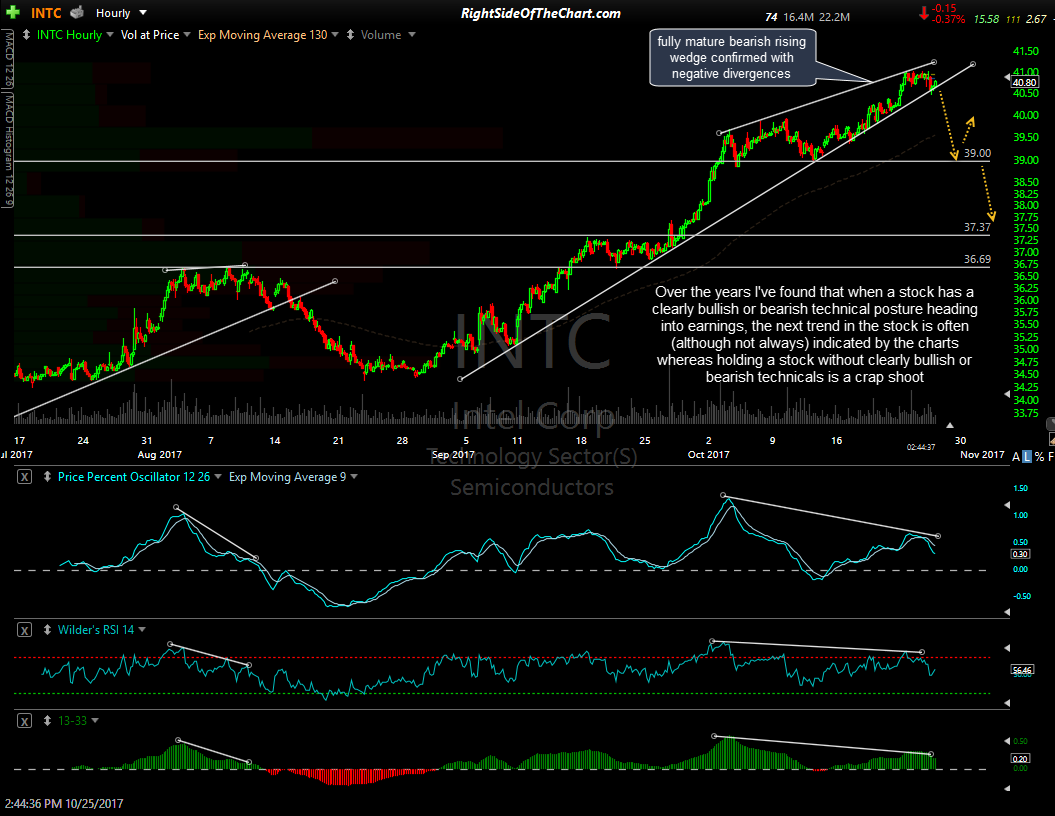
INTC 60-minute Oct 25th
Should that prove to be the case, a decent correction in INTC based off that 60-minute time frame could have more lasting implications as large divergences are building on this 10-year weekly chart of INTC. Any move back below the 37.70ish level would constitute a failed breakout while a break & weekly close below the primary (purple) uptrend line would indicate that the bull market in this leading semiconductor stock may have ended. Again, a lot of “if’s” there so first things first & that would be to watch how the stock trades on Friday & into next week.
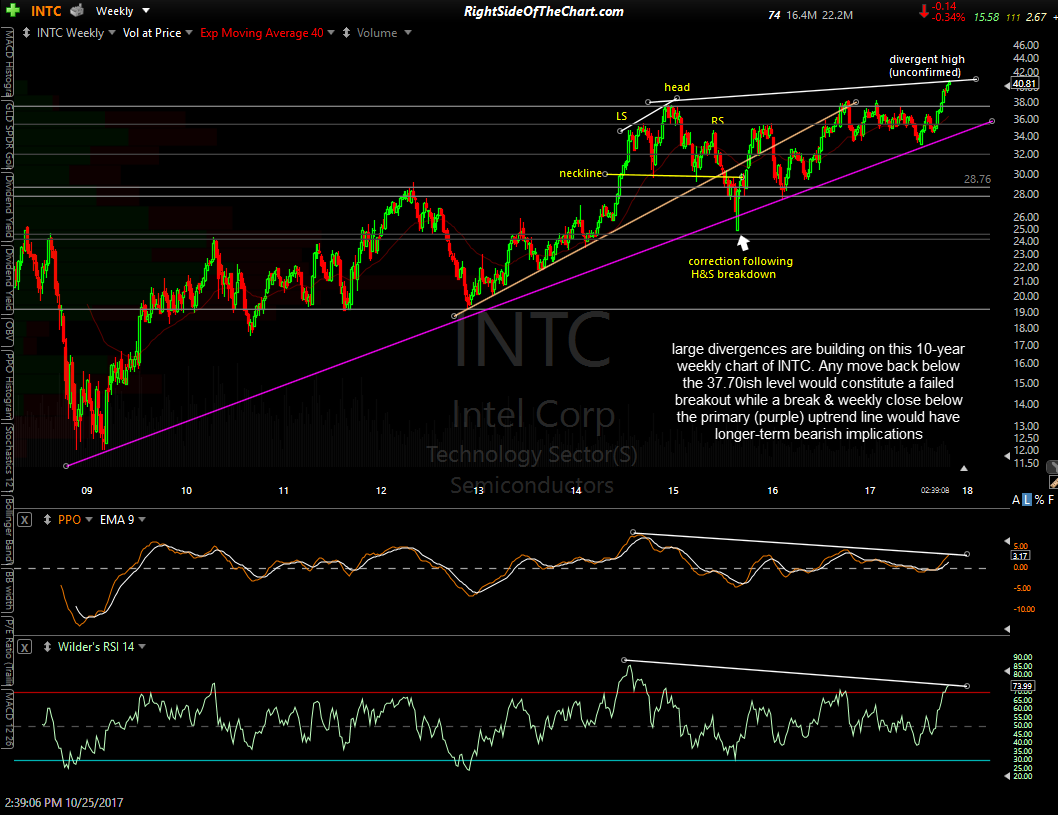
INTC weekly Oct 25th