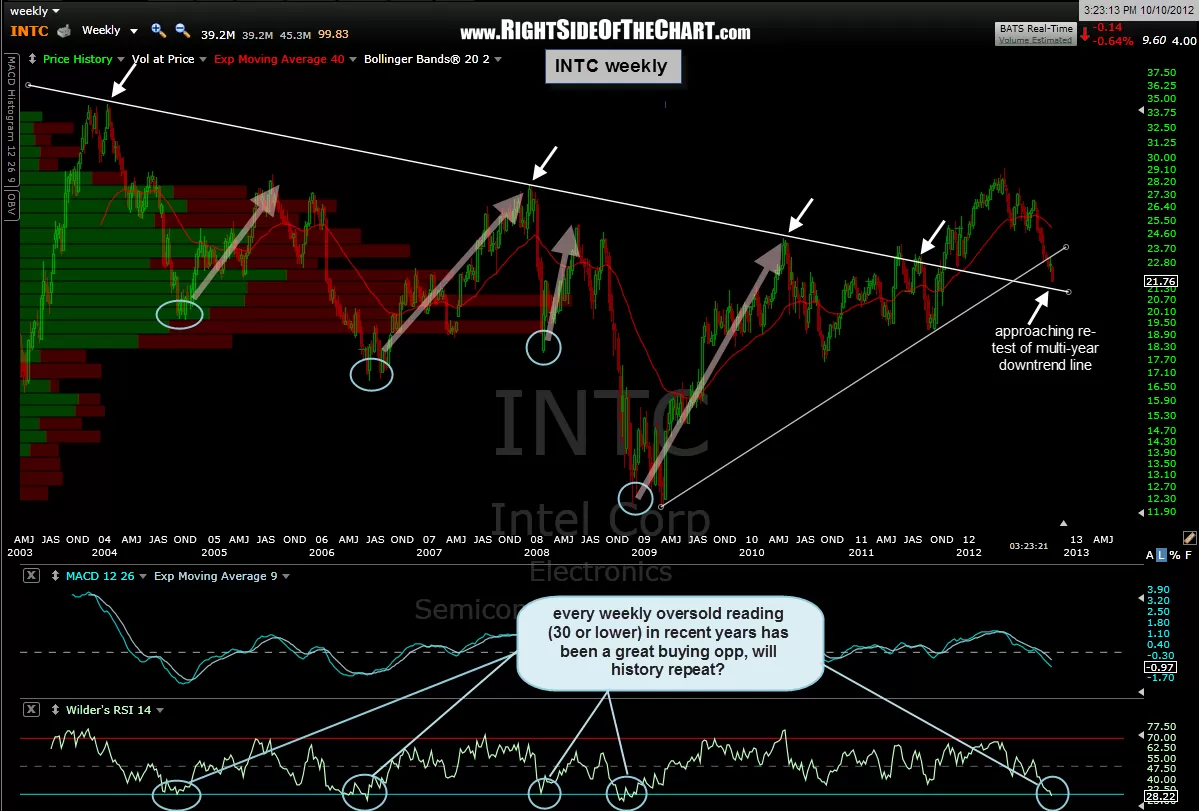
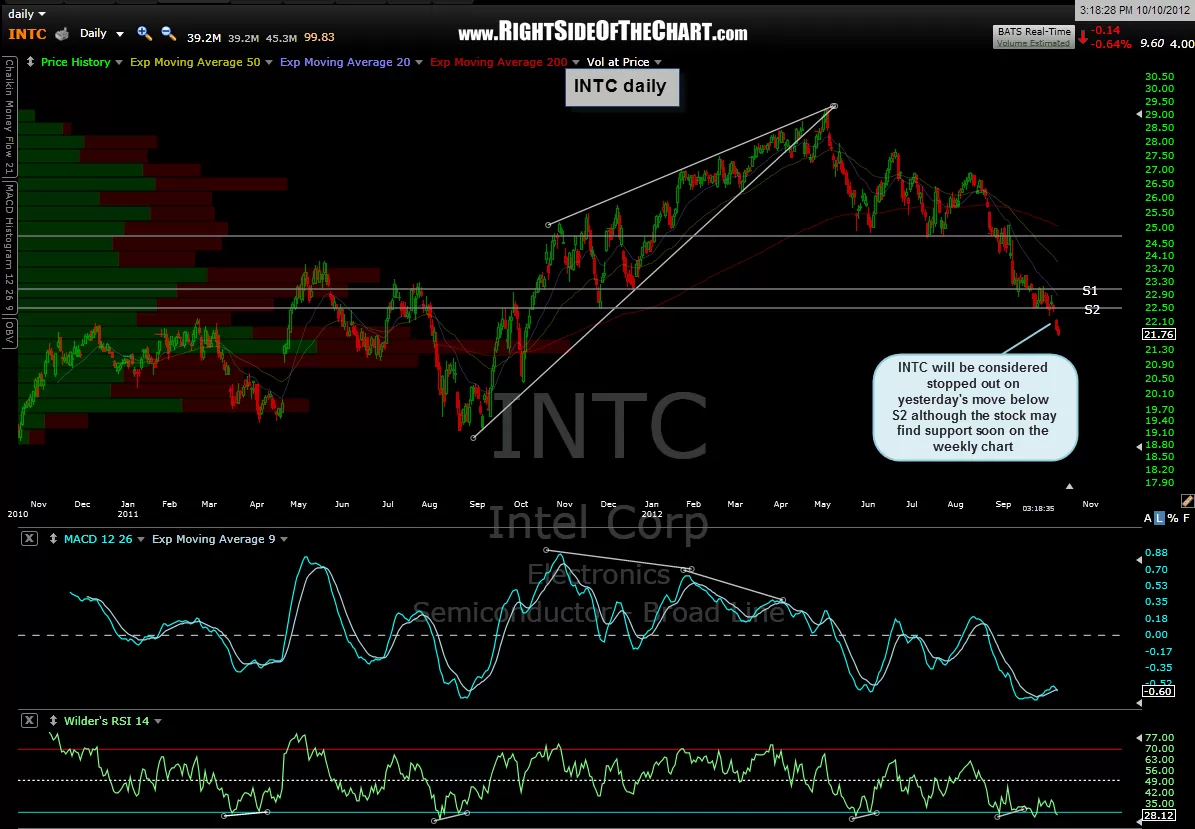
this may sound a bit confusing but i am removing the current INTC long as it was stopped out yesterday as per the previously posted criteria (a break below S2 on the daily chart) and also considering adding the stock back as a long-term trade idea soon. although INTC has lost support on the daily chart, the stock may be offering a long-term buy entry soon as shown on the weekly chart below. mainly, we have two potential buy signals coming together on the leading chip maker: a re-test of an 8+ year downtrend line that INTC made a bullish breakout from in Q4 ’11, as well as a rare oversold RSI (weekly) reading below the 30 level. as the chart below shows, all such readings over the last 8+ years have been excellent long-term buying opportunities on the stock. as i am over-weighting the $NDX/QQQ with my current swing shorts (via both QQQ derivatives as well as select individual stocks), i might start scaling into INTC for a longer-term hedge/hold soon.
as i had a suggested stop on the recent INTC long listed on a move below S2, i will remove it from the active trades category but will be watching the charts to confirm an new long-side entry. of course longer-term traders or investors who took the trade might choose to give INTC some more room here based on the potentially bullish weekly chart. however, keep in mind that oversold can get “more oversold” or stay oversold for longer than expected. price moves down to downtrend lines, even if they do hold, can continue re-testing while prices ride the trendline lower for some time. therefore, i would like to see the broad market and shorter-term charts on INTC confirm a new long entry before taking a new position.