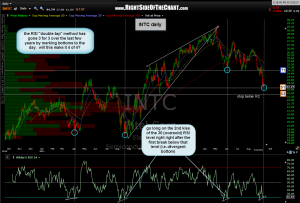
 one last long to finish the day. had i noticed this pattern earlier, i would have posted it during market hours. however, barring any crazy upside gap tomorrow, i will add INTC as a long at the open. INTC was recently covered in the $NDX top 10 holdings video posted a couple of weeks ago when i discussed that it was likely to break that horizontal support level, now shown as T1 (first target) on this chart. the stock did indeed drop sharply since then but should be due for a decent bounce here shortly.
this daily chart shows that the RSI penetrated below the 30 (oversold) level recently on august 30th, followed by a sharp but quick bounce and has now fallen back to the 30 level, putting in a higher low (i.e.-positive divergence). as i like to point out, patterns never continue indefinitely but do help put the odds of a trade playing out in your favor, especially when aligned with other buy signals. the target and an objective stop level are shown on this daily chart.
i noticed this pattern while review the top 10 $NDX components after the close today. fwiw, my overall technical read on the group remains bearish although a few of the components are at or near support levels where they will likely either experience a bounce (most likely short-lived) or breakdown. however, as INTC is by far the most oversold of the group, i feel that it currently offers the best R/R on the long side.

