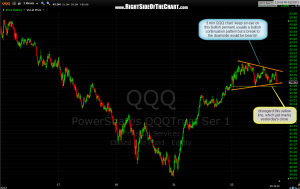
 here’s a 3 minute chart of the QQQ showing a bullish pennant, which is considered a continuation pattern and usually breaks to the upside. if so, the pattern should measure to around th 64.80ish level on the Q’s (depending on where the pattern breaks above the pennant). however, a downside break would be bearish so something to keep and eye on as we get ready to head into the final hour of trading. btw- the SPY has a very similar pattern which should also be monitored as well.

