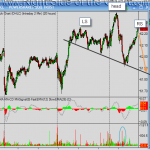
here’s a snap-shot of charts that made a litttle earlier but then decided to watch prices for a bit to avoid posting prematurely. as i’ve recently stated, i think that head & shoulders patterns are some of the most over-used patterns by traders (at least in the blog-o-sphere world). however, as they say: “when in rome.…”. essentially, since it is my read that that traders are flying by IFR (instruments, i.e.-chart patterns) right now, these potential H&S patterns on the intraday charts (2 min charts shown here) are something that i’ll be monitoring. so far, the requisite impulsive selling on increase volume was seen coming off of what could be viewed as the head. now we would have to see prices turn down here soon with another increase in volume. if so, that would help “validate” this pattern (although i usually don’t put too much stock into H&S patterns on anything less than the daily or weekly frames). although i could have drawn the pattern on the IWM (chart on right), i preferred to note that horizontal resistance level, which so far as i type, we have turned down from. again, only something to monitor at this point but if those patterns are completed as per the criteria above, i think it could make for an objective short entry or add-on if/when the necklines break. disregard these potential patterns if prices on the QQQ and SPY (two charts on left) take out today’s earlier highs. currently, the Q’s are threatening a push to new highs and disrupting the symmetry on this pattern while the SPY and IWM are lagging behind on the bounce & therefore, i do think that they might still have a chance. i’ll do an updated SPY chart using a 5 min frame in a minute.


