
Still awaiting a break of S1 (1st support), which has since come to define the bottom of the multi-month trading range, to trigger the next leg down to the IBIT price targets. Previous (Dec 9th) & updated 60-minute charts below.
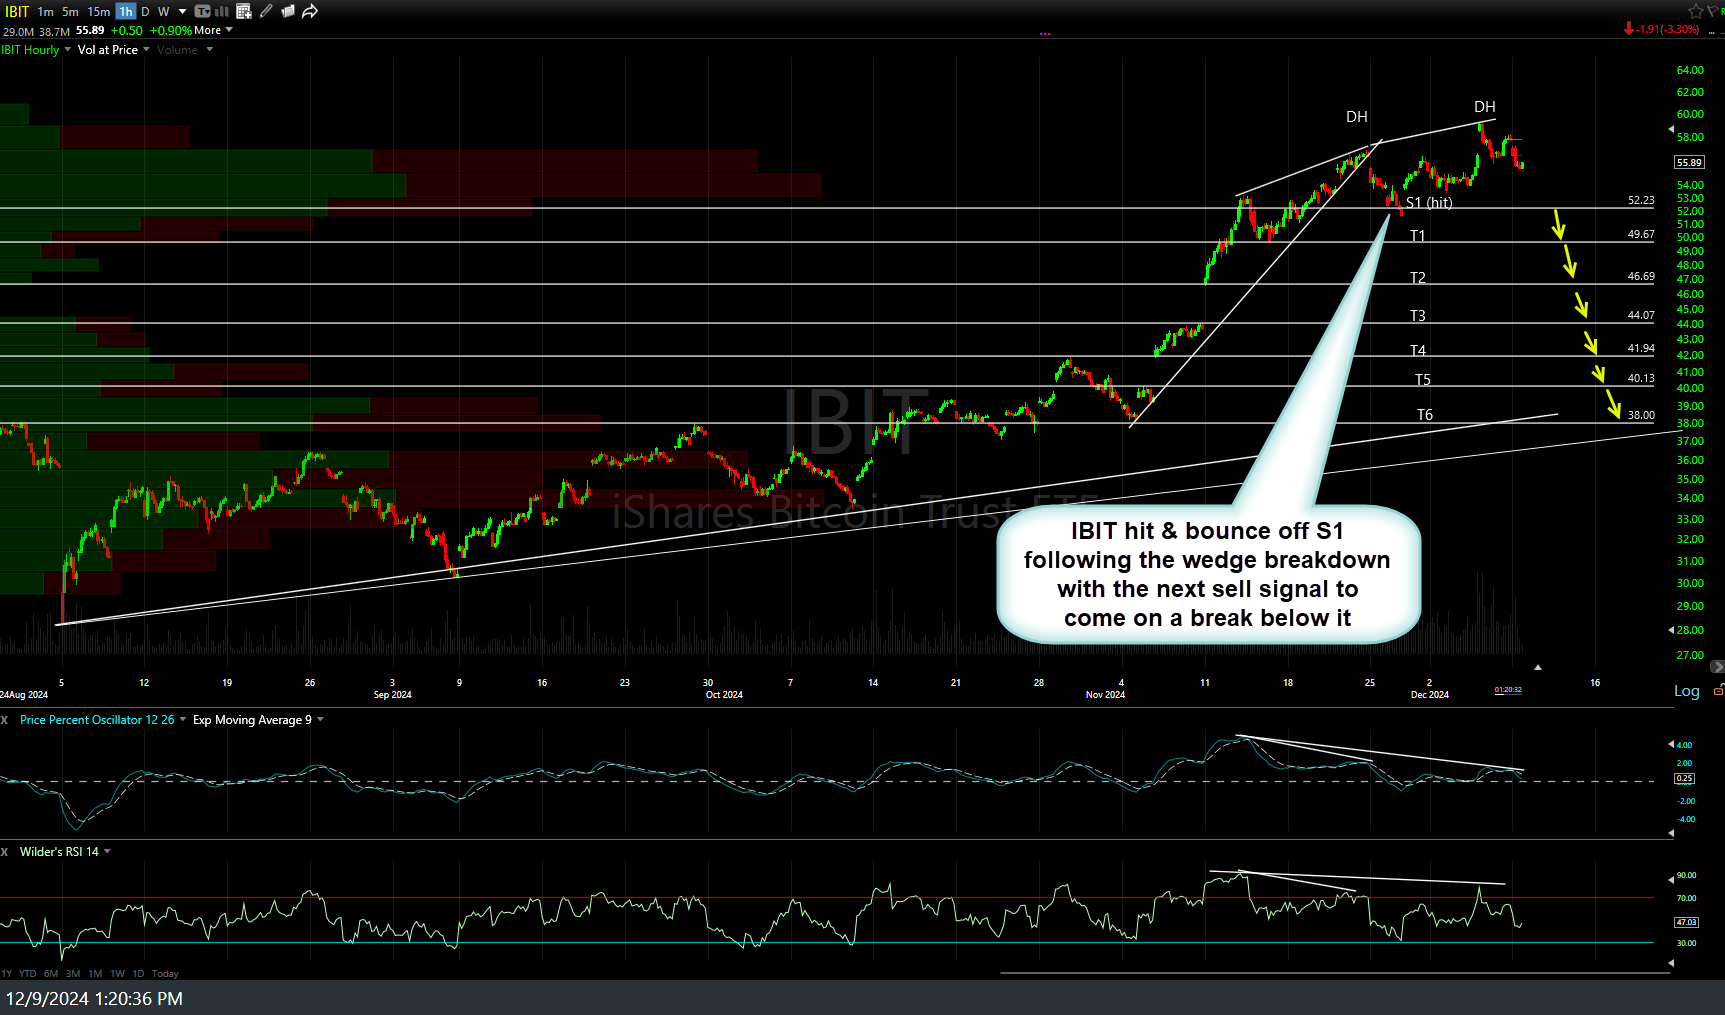
IBIT 60m Dec 9th

IBIT 60m Feb 11th
Zooming out to the daily time frame, a downside break of the multi-month trading range would likely trigger an 18%+ drop IBIT Bitcoin (most likely scenario IMO) while an upside break of the range (unless false breakout) bullish.

IBIT daily Feb 11th
If you get a sense of déjà vu looking at the charts above, it’s because of that strong “risk-on” asset correlation that Bitcoin has to the stock market, particularly the high-beta/AI-tech heavy Nasdaq 100, with the nearly identical technical posture (multi-month trading range with divergent high). The chart below shows the comparable trading range & minimum price target, should Bitcoin & the Nasdaq 100 both break down below my red support levels, on $BTC (Bitcoin crypto).
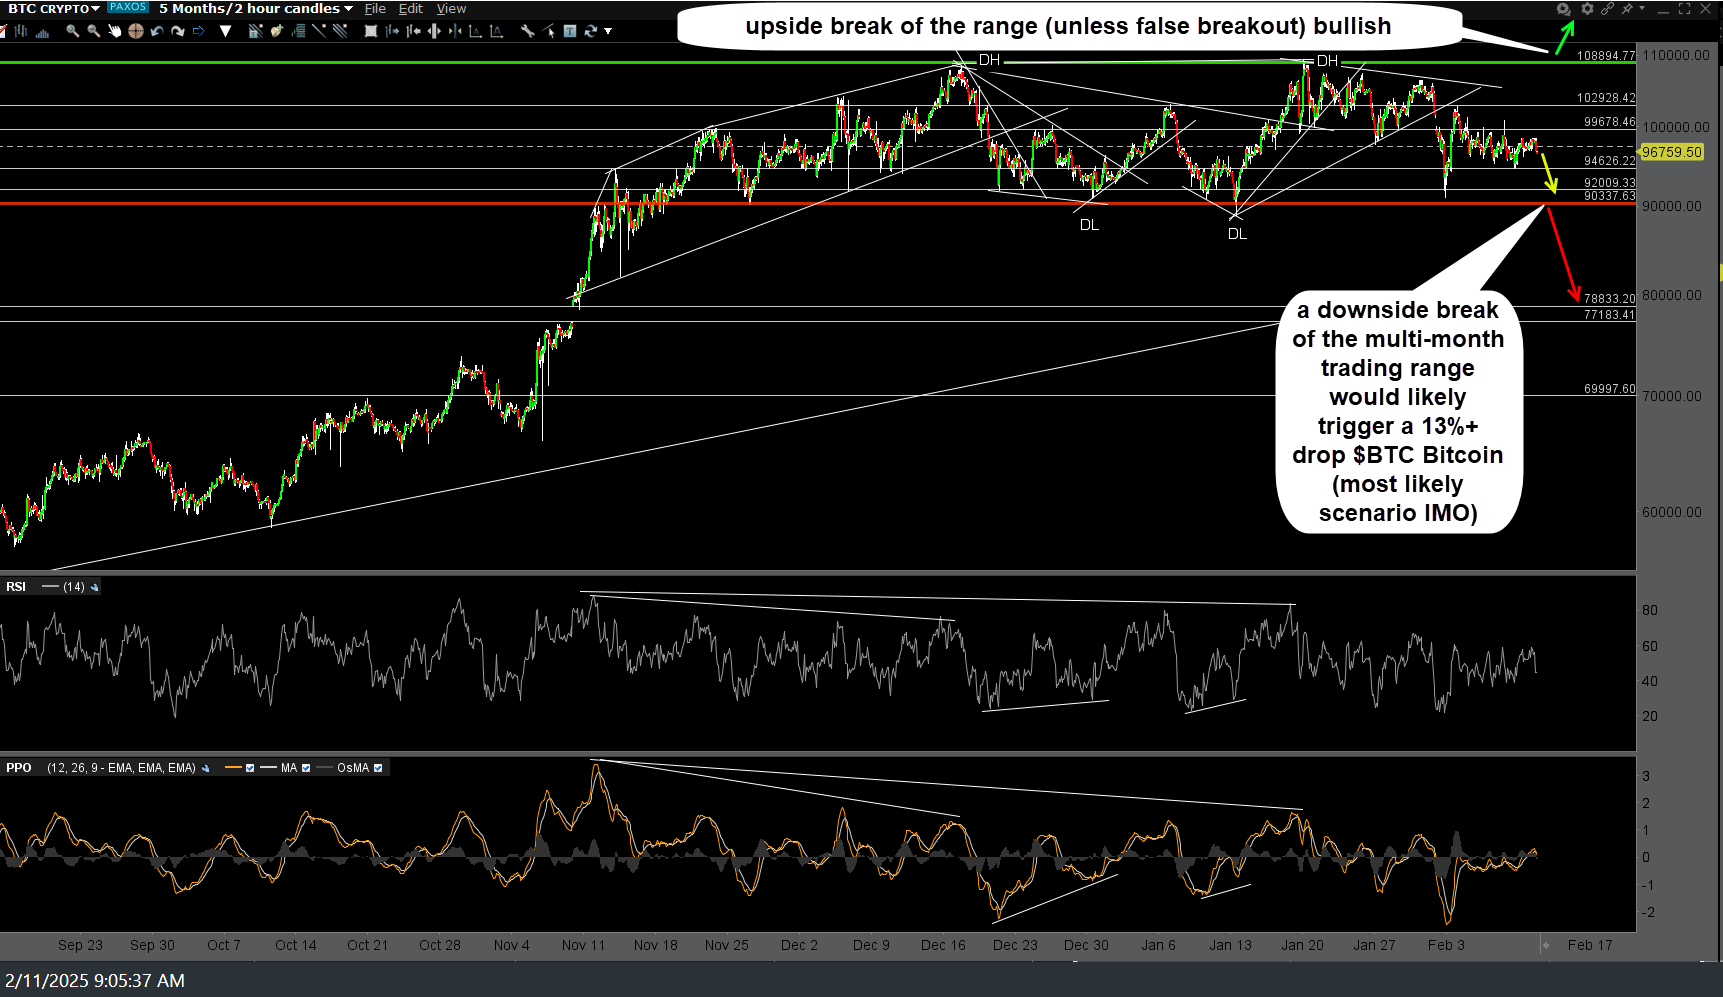
$BTC 120m Feb 11th