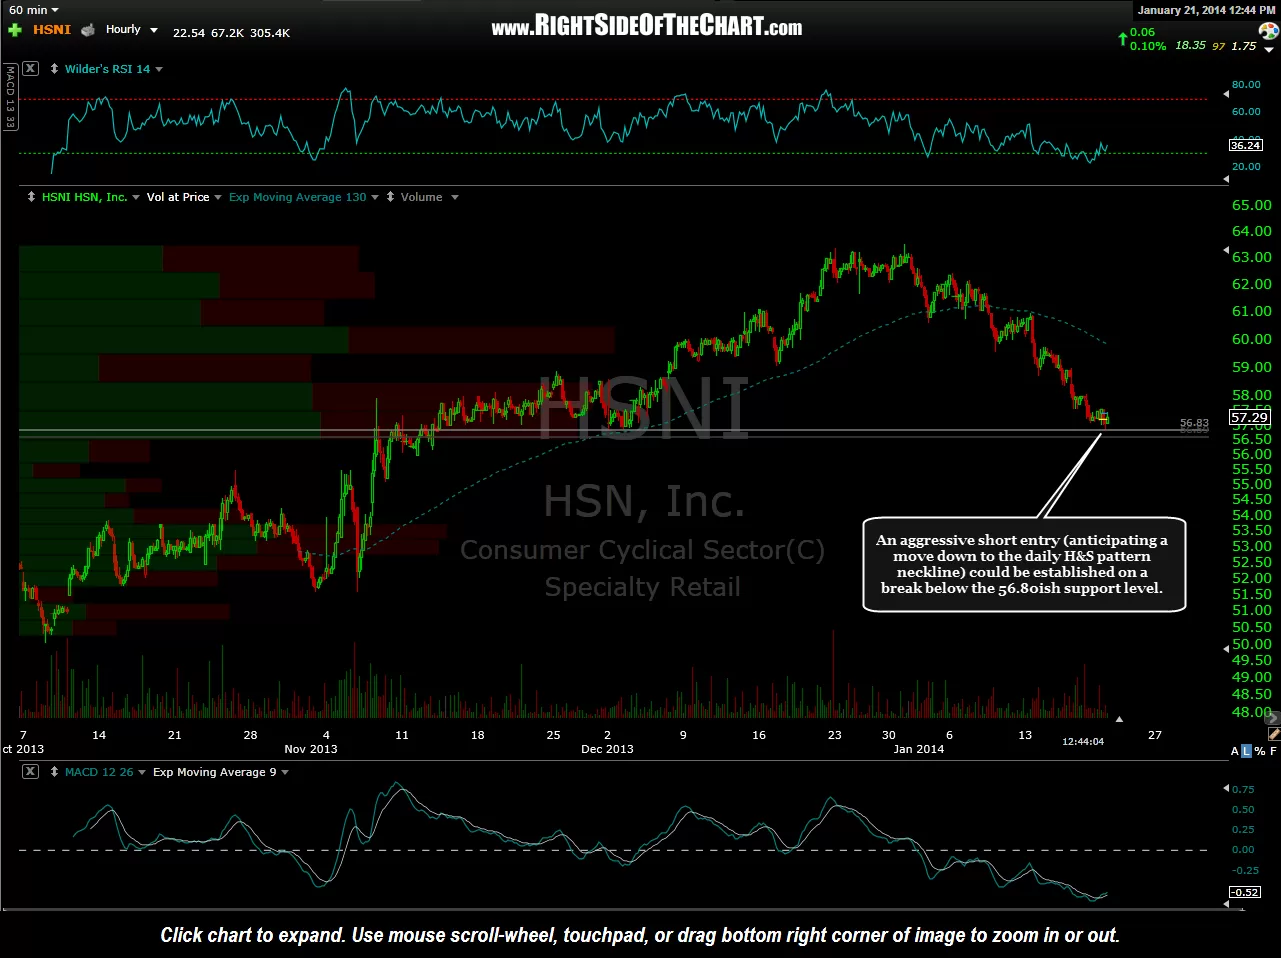
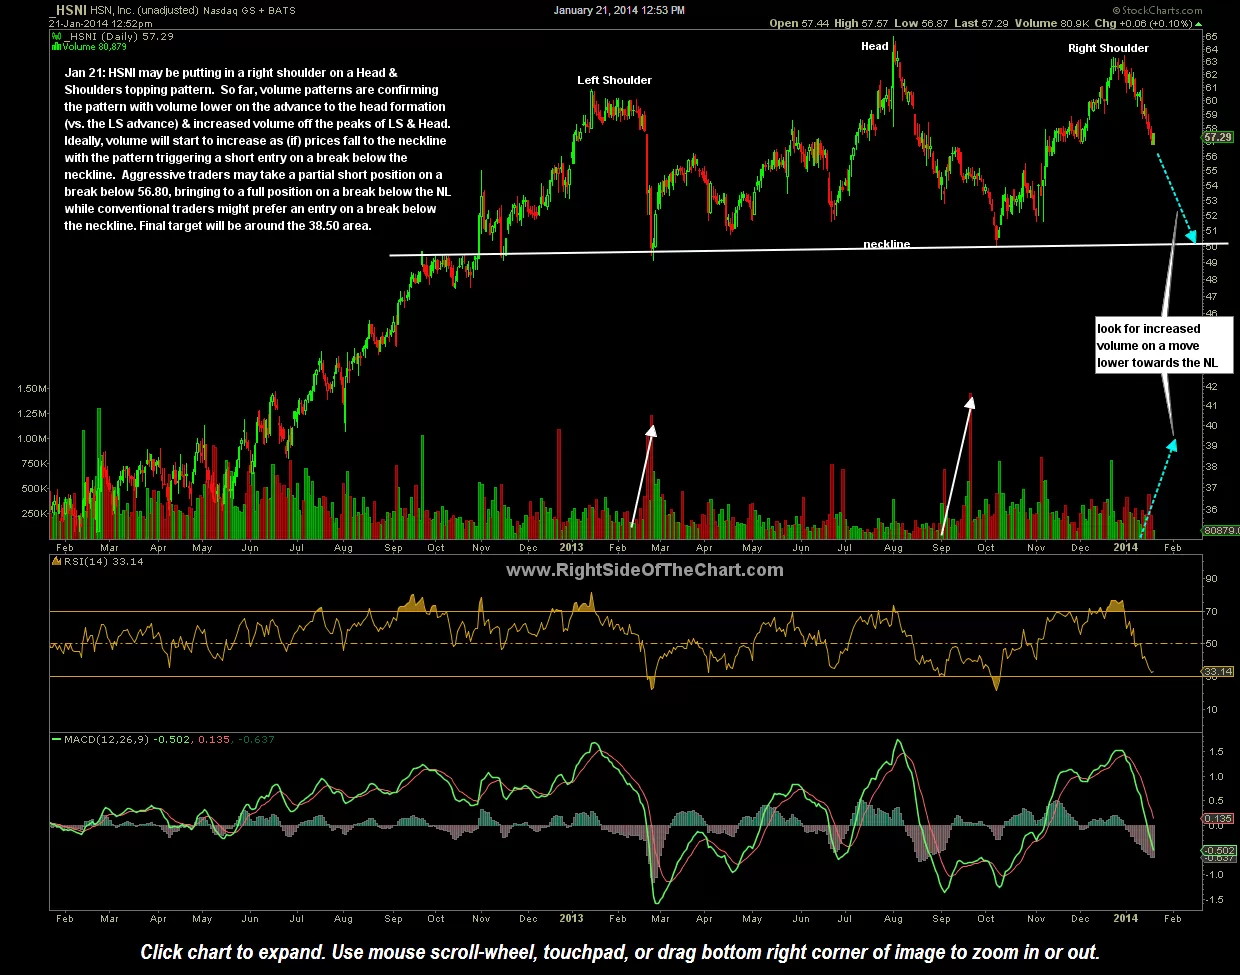
HSNI (HSN, Inc) may be putting in a right shoulder on a Head & Shoulders topping pattern. So far, volume patterns are confirming the pattern with volume lower on the advance to the head formation vs. the left shoulder advance as well as increased selling volume coming off the peaks of the left shoulder & head. Ideally, volume will start to increase as (if) prices fall to the neckline with the pattern triggering a short entry on a break below the neckline. Aggressive traders may take a partial short position on a break below 56.80, bringing to a full position on a break below the neckline while conventional traders might prefer an entry on a break below the neckline. Final target will be around the 38.50 area which is not only the approximate measured target of the pattern but also a shelf of horizontal price support defined by both the volume at price histogram as well as the consolidation in the stock that took place from Q3 2011 through mid-2012. The 56.80 aggressive short entry trigger is based on a short-term support level as shown on the 60 minute chart below. Click here for the live daily chart of HSNI.
-
- HSNI Head & Shoulders Pattern
-
- HSNI 60 minute support