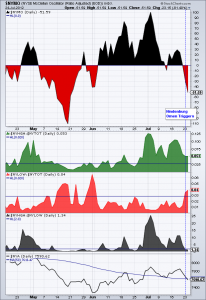
 There has been a lot of chatter over the last few years as to whether or not the Hindenburg Omen still has any useful predictive value (largely due to the proliferation of inverse etf’s, which effect the new highs and lows readings). We also often see a lot of bantering from those who try to disqualify the still rare HO signals and those who are quick to use the signal to claim that all criteria have been met, thereby confirming the signal. Keep in mind that since the signal’s inception, there have been several tweaks and additional qualifiers added to it by various technicians, such as using a rising 10 week moving average on the NYSE vs. the current, more popular condition of prices being higher than they were 50 days ago. Here’s a link to the Wikipedia definition, which does a pretty good job of discussing it.
This chart, by Arthur Hill of Stockcharts.com, appears to confirm that the signal was triggered yesterday and whether or not some other variations of HO criteria did or did not confirm this signal, I think that the crux of what this chart shows, taken in context with the current bearish technicals, fundamentals, and investor complacency, only adds to the risks of a large downside move in stocks. Just because the odds of something happening are elevated, it does not mean that it MUST happen. Nothing is guaranteed in the markets and sometimes it’s darkest just before dawn so stay flexible and be prepared for all possible outcomes.

