
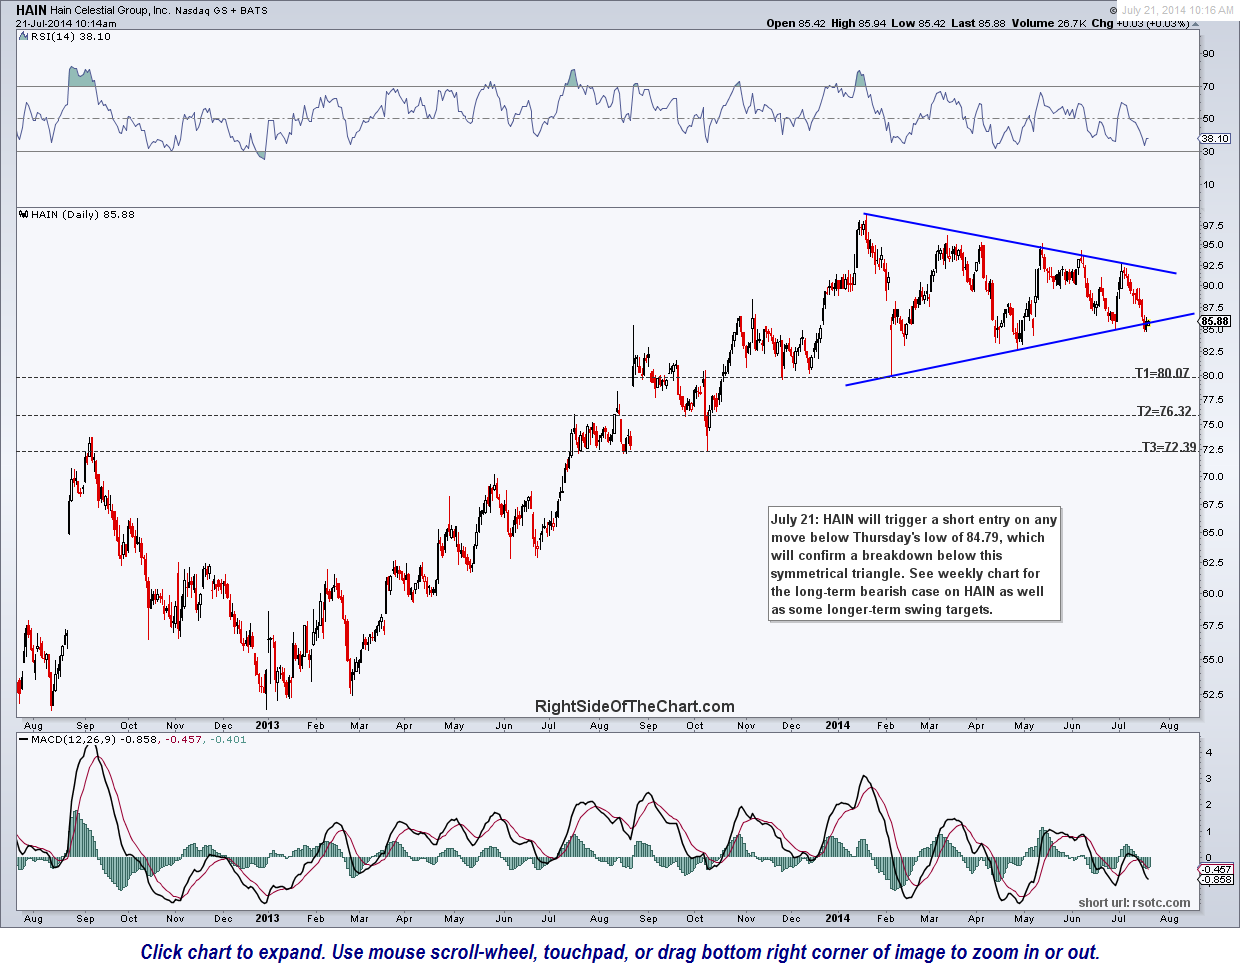
HAIN (Hain Celestial Group Inc) will trigger a short entry on any move below Thursday’s low of 84.79, which will confirm a breakdown below this symmetrical triangle (daily chart).
As the weekly chart below illustrates, a more powerful, longer-term sell signal on HAIN will come on a weekly close below the multi-year primary uptrend line in the stock which makes up part of a very large bearish rising wedge pattern, complete with negative divergences on the PPO & RSI leading up to the January 21st top in the stock.
-

- HAIN daily July 21st
-
- HAIN weekly July 21st

click here to view the live, annotated daily chart of HAIN click here to view the live, annotated weekly chart of HAIN