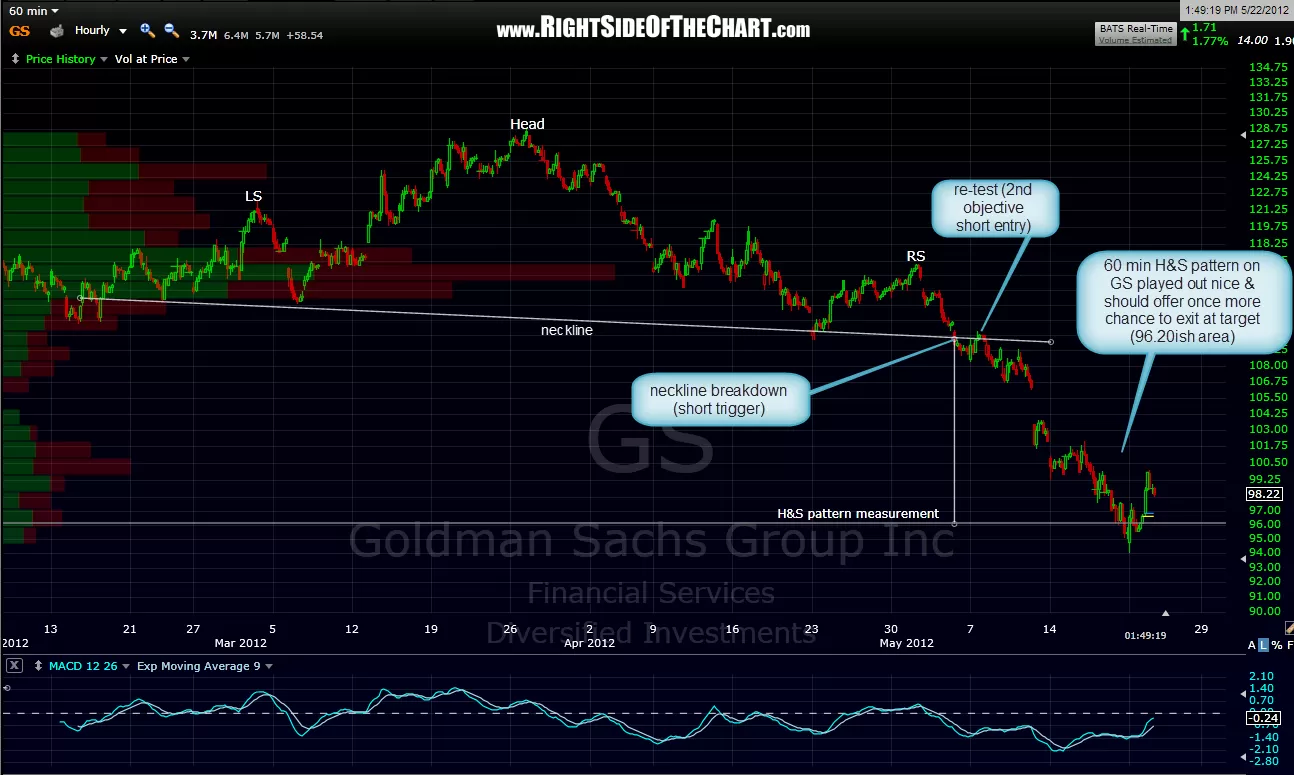
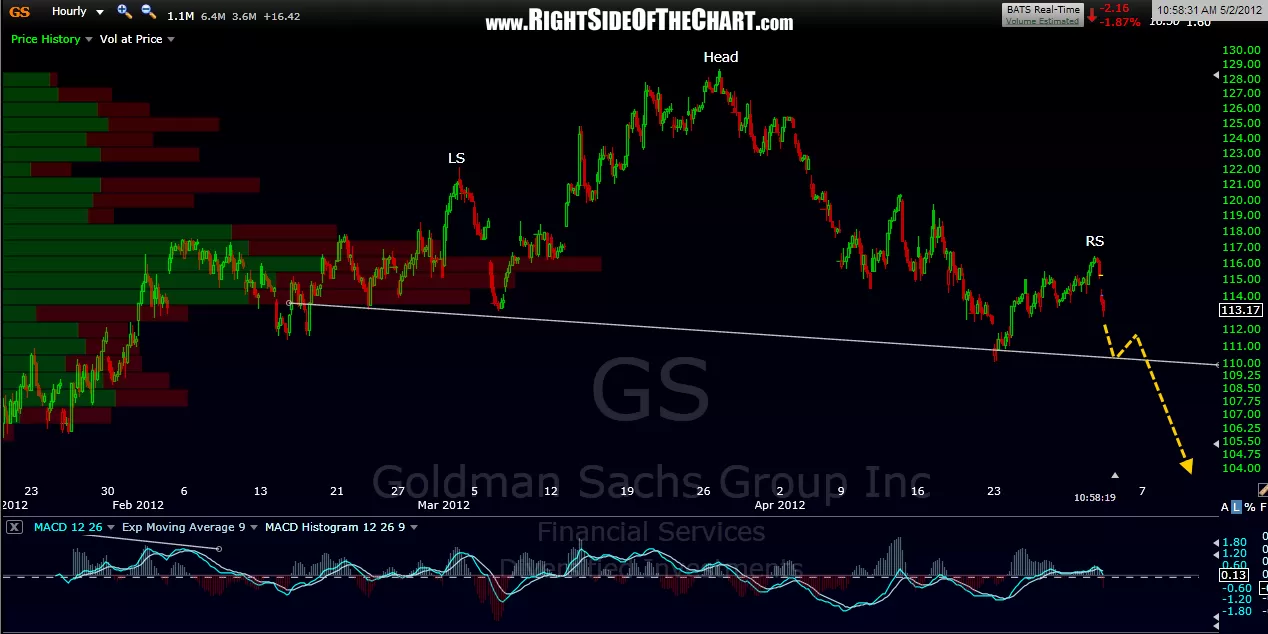
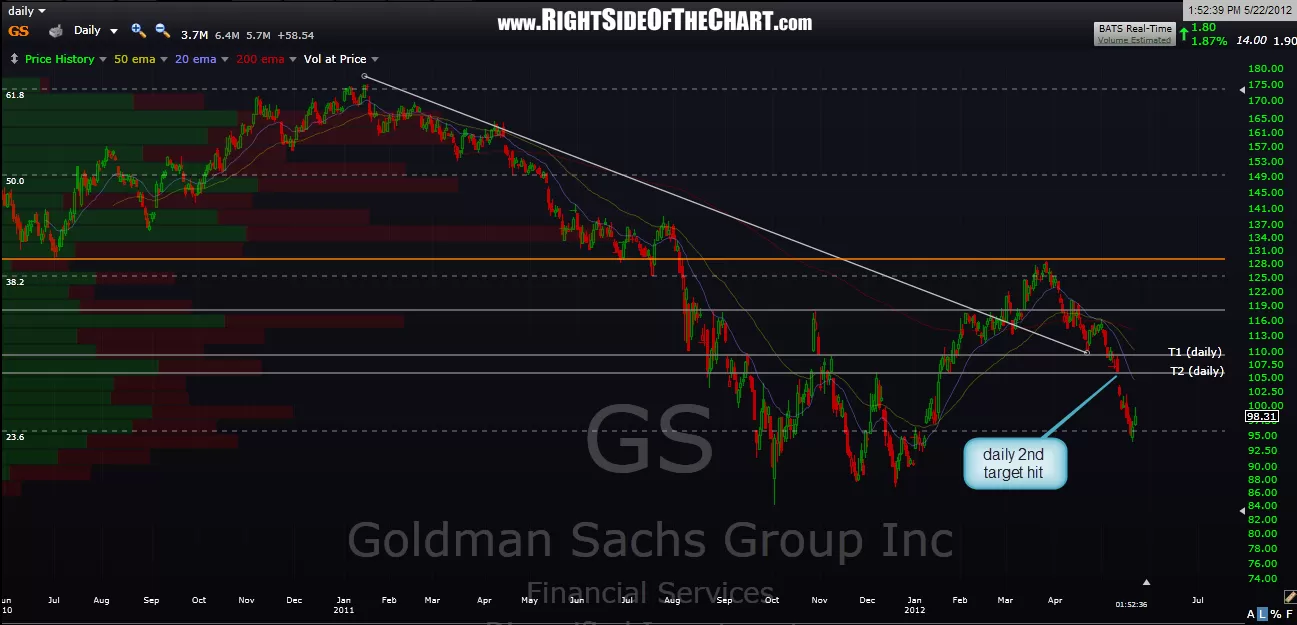
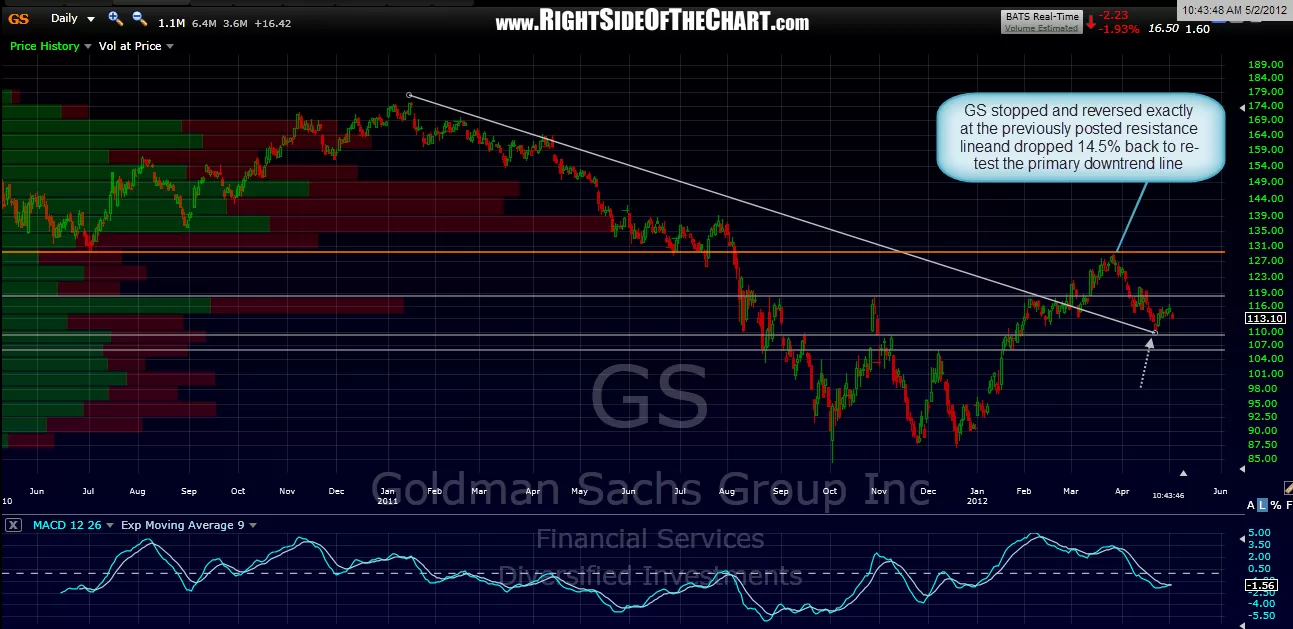
as i continue to update the set-ups and active trades posted here, i just came across GS which i realize that i haven’t updated in a while. in my last post, i mentioned these two horizontal support lines on the daily chart as likely targets and i also posted this 60 minute H&S pattern, which has since broken down, made a text-book re-test of the neckline (offering a very objective 2nd entry) and then went on to hit the pattern measurement and then some. since i have not updated it, nor did i explicitly state that 60 minute target in the last post, i will leave this on as an active trade for now. of course, GS is trading not far above that 60 minute target now and could still be exited for a nice gain, or a huge gain if shorted off the daily chart entry. of course, i wouldn’t leave this trade on if i didn’t think the odds were good that GS will move back down to that 60 minute target level again either. however, if still short GS, you should consider placing a stop not too far above to protect profits. GS daily and then 60 minute charts below.