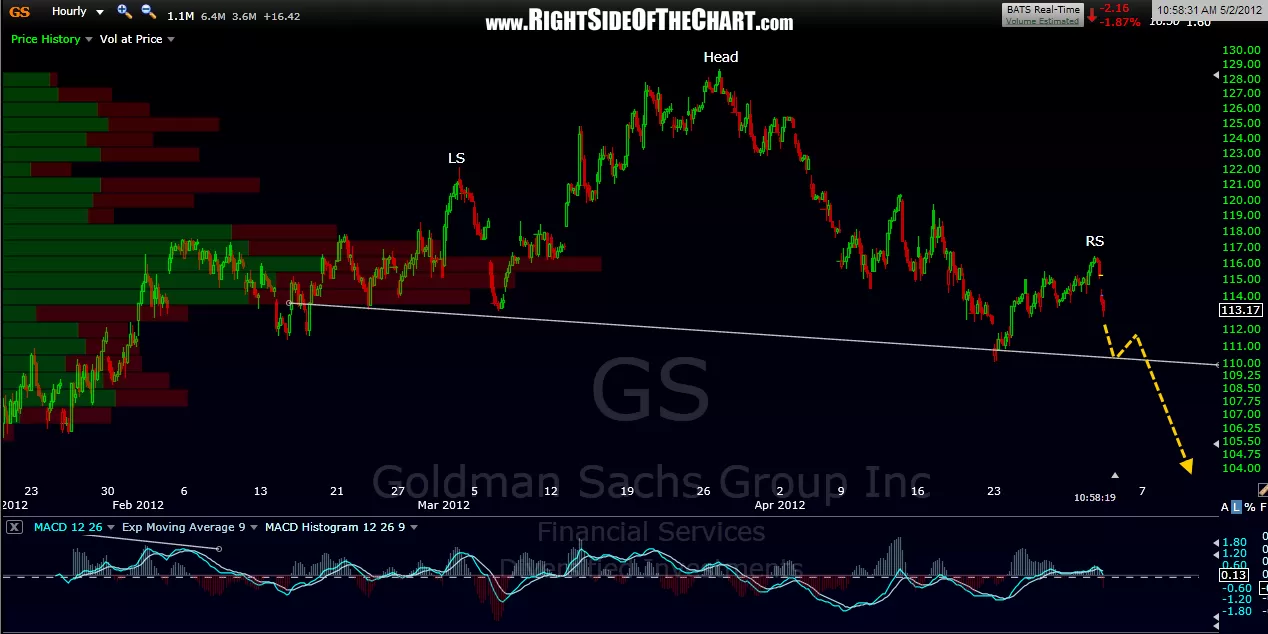
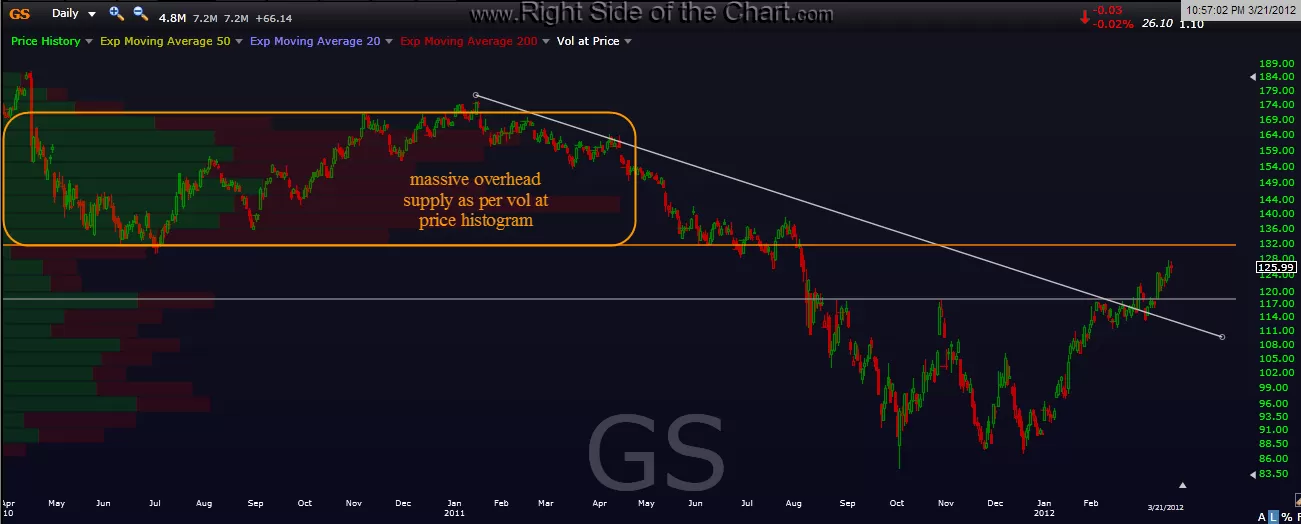
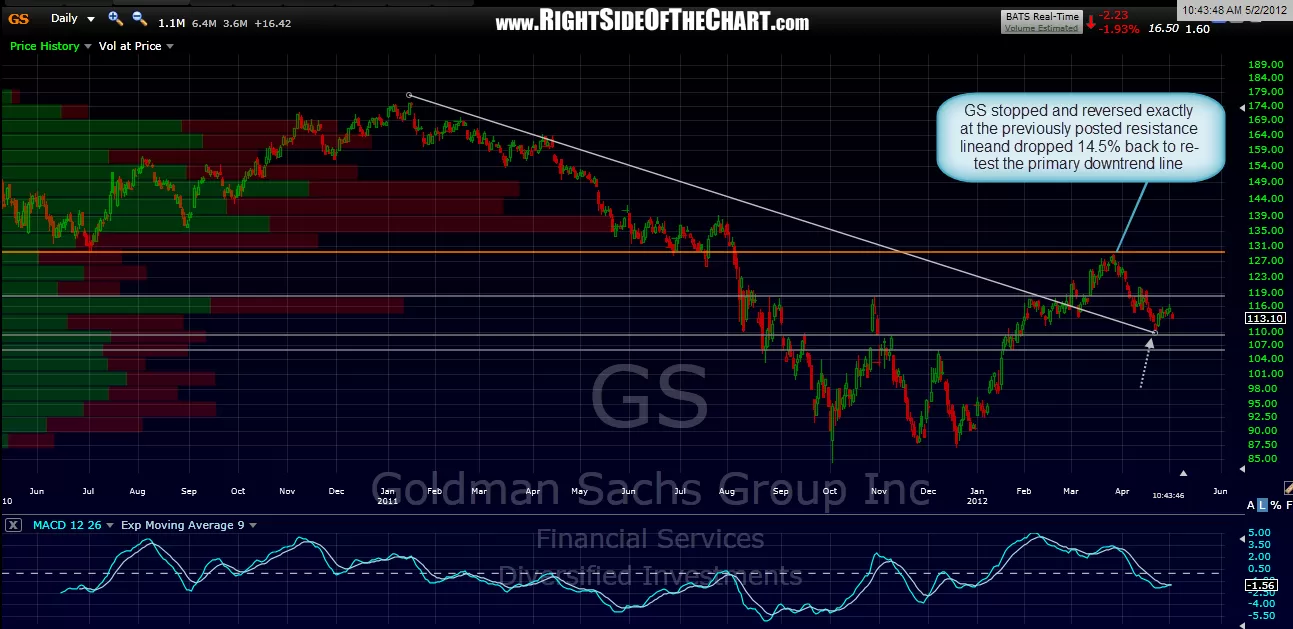
i just realized that i have not updated the GS short set-up posted back on march 21st (2nd chart below) with any follow-up charts or notes, although i did add it to the active trades category back then. since that post, GS went on to hit that resistance level (orange line), turned down and fell all the way back to re-test the primary downtrend line. my apologies for not making any follow-up posts to that set-up, both when prices hit the resistance line (objective entry) or adding targets once the trade became active but fwiw, i think that anyone still in the trade will get a chance to cover at lower levels. the two horizontal support lines below prices on the update chart should provide additional exit points for the trade although GS is still only about 3% off the recent low should one want to book profits or lower stops here. as i did not post targets with the original set-up, other than showing that single horizontal support line & downtrend line, i will not move this to the completed trades category at this time. in fact, here’s some potential eye-candy for anyone still in the trade: 60 minute chart showing a possible head & shoulders formation in the final stages of putting in a right shoulder. therefore, i will keep GS as an active trade and also add as a trade set-up which would trigger a new short on a break of the neckline on the 60 minute chart.

Results for {phrase} ({results_count} of {results_count_total})
Displaying {results_count} results of {results_count_total}