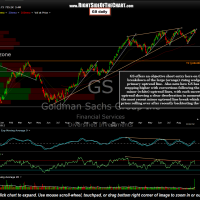
The original short entry on GS (Goldman Sachs Group) was posted on Sept 24th while GS was backtesting the recently broken large bearish rising wedge pattern (orange) as show in the first (previous) chart below. Note how GS has been stair-stepping higher with the white minor uptrend lines with clearly diminishing momentum on each new minor uptrend. The next short entry or add-on will come on a break below this most recent uptrend line. Click here to view the live, annotated chart of GS.
- GS Daily Chart Sept 24
- GS Daily Chart Dec 13


