
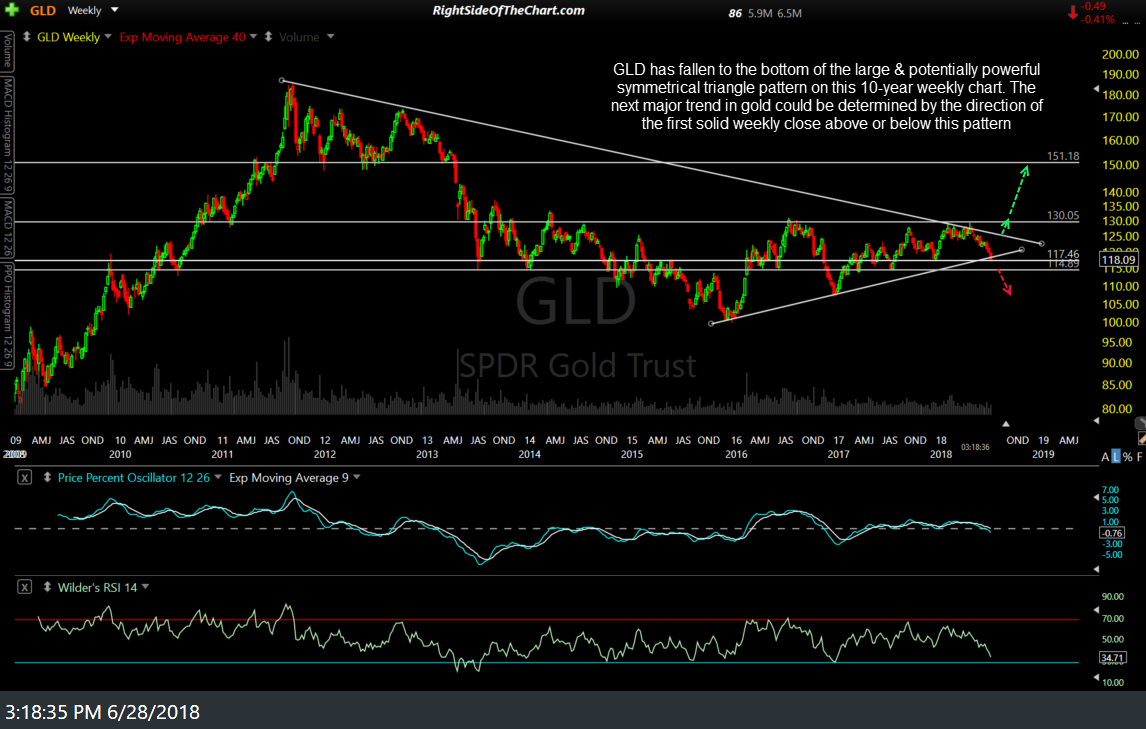
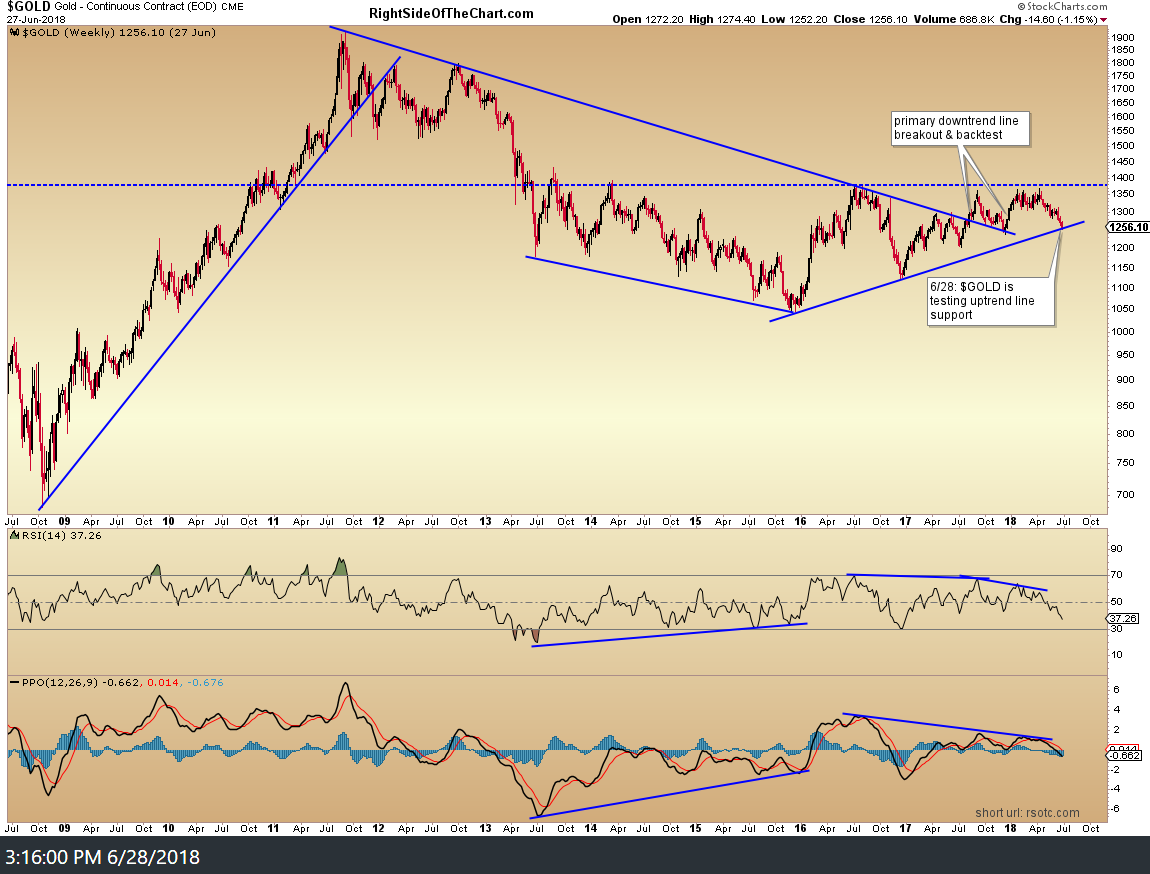
Both GLD (gold ETF) and $GOLD (gold futures continuous contract) have fallen to the bottom of the large & potentially powerful symmetrical triangle pattern on this 10-year weekly chart. The next major trend in gold could be determined by the direction of the first solid weekly close above or below the triangle pattern.
-

- GLD weekly June 28th
-

- $GOLD weekly June 28th
Zooming down to this 6½ year daily chart, note how nearly all oversold readings of 30 or lower on the RSI (circled in green) were followed by at least a tradable rally in gold. Therefore, with the current oversold conditions on gold coupled with the fact it is trading at key trendline support, increased the odds for a least a decent counter-trend rallying in the coming weeks.
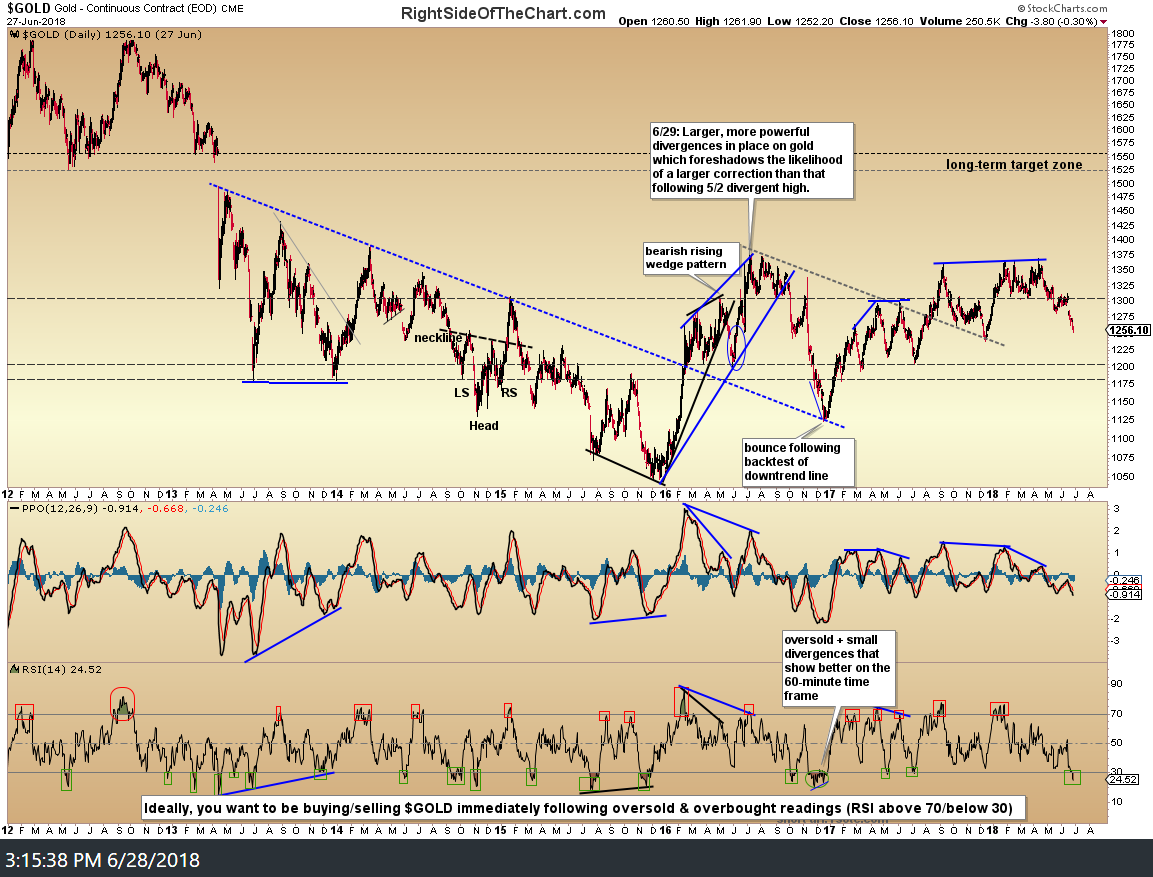
$GOLD daily June 28th$GOLD
Additionally, the fact that gold is pinching close to the apex of the larger triangle pattern means that we could see a major breakout in either direction soon as well. With the trend on gold bullish since the late 2016 lows along with the fact that oversold readings during a bull trend are usually fleeting & not persistent as they often are during bull markets, I favor a bullish resolution of this triangle pattern.
Should gold make an impulsive break to the downside, I would then favor a kickback rally shortly afterward for a backtest of the trendline from below. Once again, only weekly candlestick closes matter when trading off of the weekly time frame.