
Updated 30-minute chart of GDX (gold miners ETF) highlighting the confirmed negative divergence along with several key support/target levels, many of which line up nicely with key Fibonacci retracement levels.
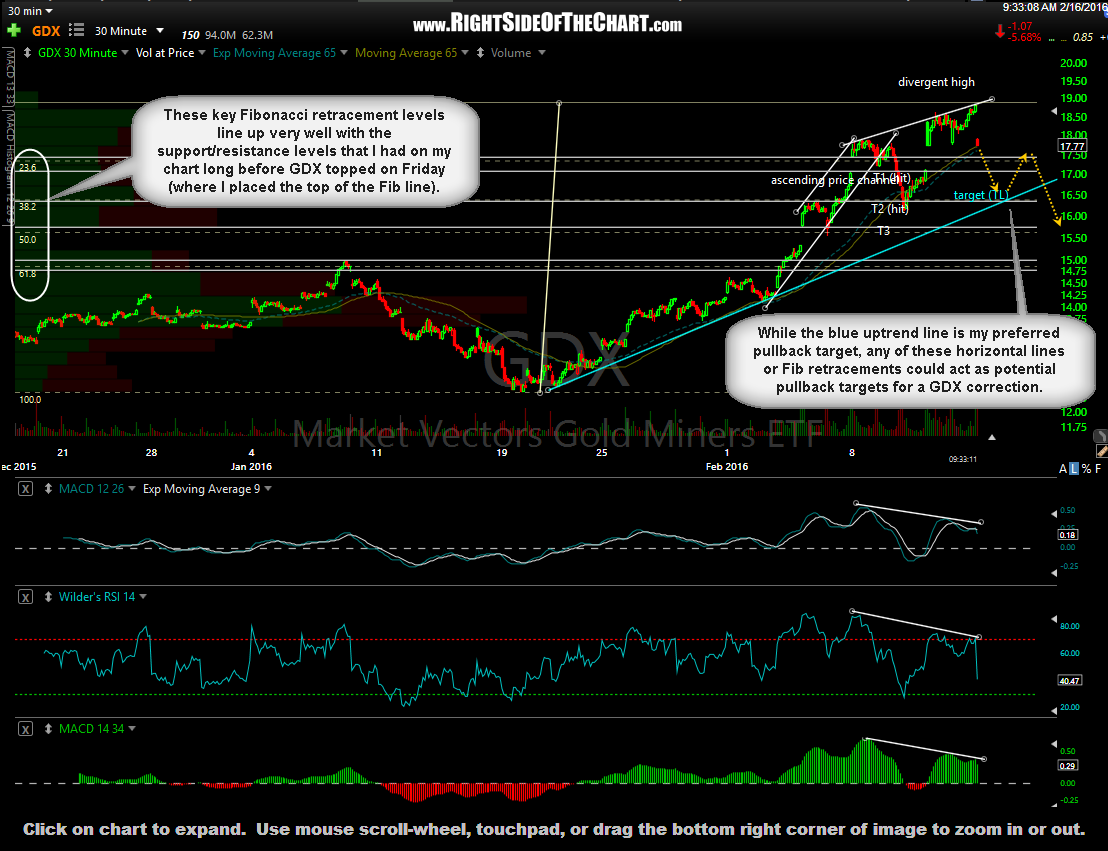
GDX 30-minute Feb 16th
As discussed in the recent Gold Mining Trends video, the $HUI is currently challenging the key 20-month MA with nearly all long-term indicators solidly bearish at this time. Overall, the recent breakout in GLD & GDX on both the daily & weekly time frames can only be viewed as longer-term bullish at this time although the potential for a bull trap still exists over the next week or two, should gold and/or GDX fail to hold those key daily & weekly former resistance, now support levels. We also continue to see a very tight inverse correlation to GLD/GDX and equity prices (SPY/QQQ, etc…) meaning should that correlation continue going forward, the extent of any pullback in gold & GDX will depend largely on how much, if any, the broad markets will rally into options expiration at the close of trading this week.
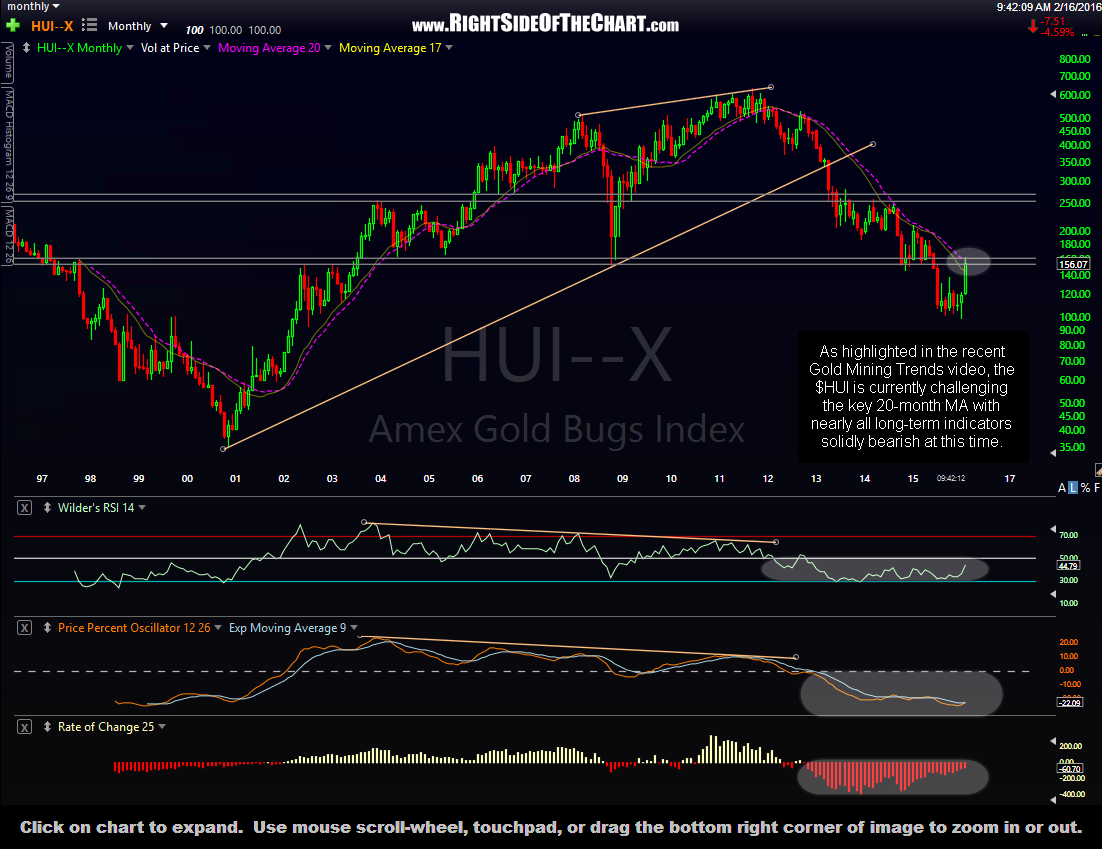
$HUI 20-year monthly Feb 16th