
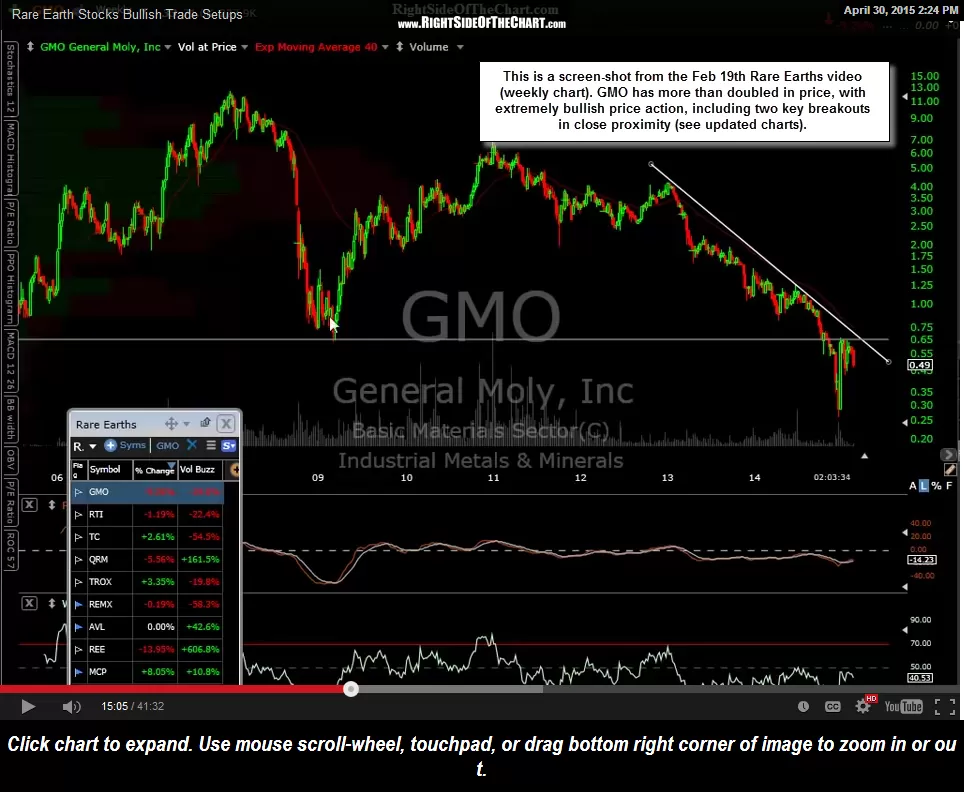
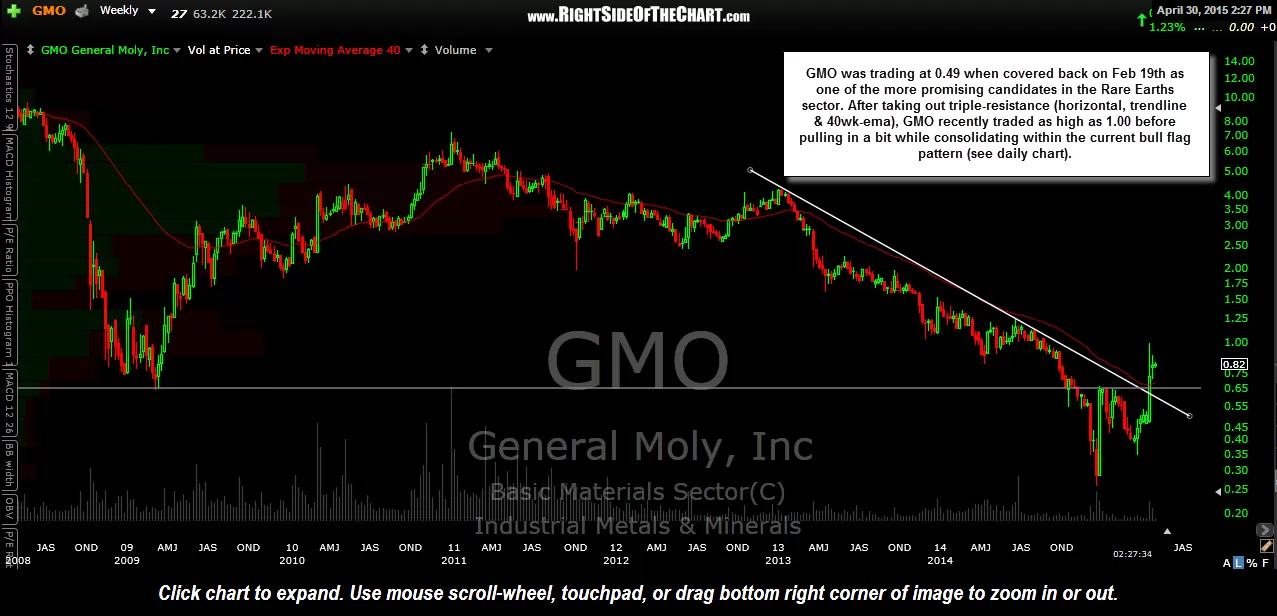
GMO (General Moly Inc) was trading at 0.49 when covered in the Feb 19th Rare Earths video as one of the more promising candidates in the Rare Earths sector. After taking out triple-resistance (horizontal, trendline & 40wk-ema), GMO recently traded as high as 1.00 before pulling in a bit while consolidating within the current bull flag pattern (shown on the updated daily chart).
-
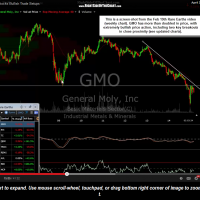
- GMO weekly screenshot from Feb 19th
-

- GMO weekly April 30th
-
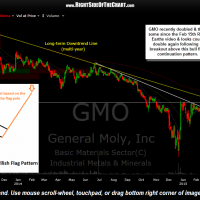
- GMO daily April 30th
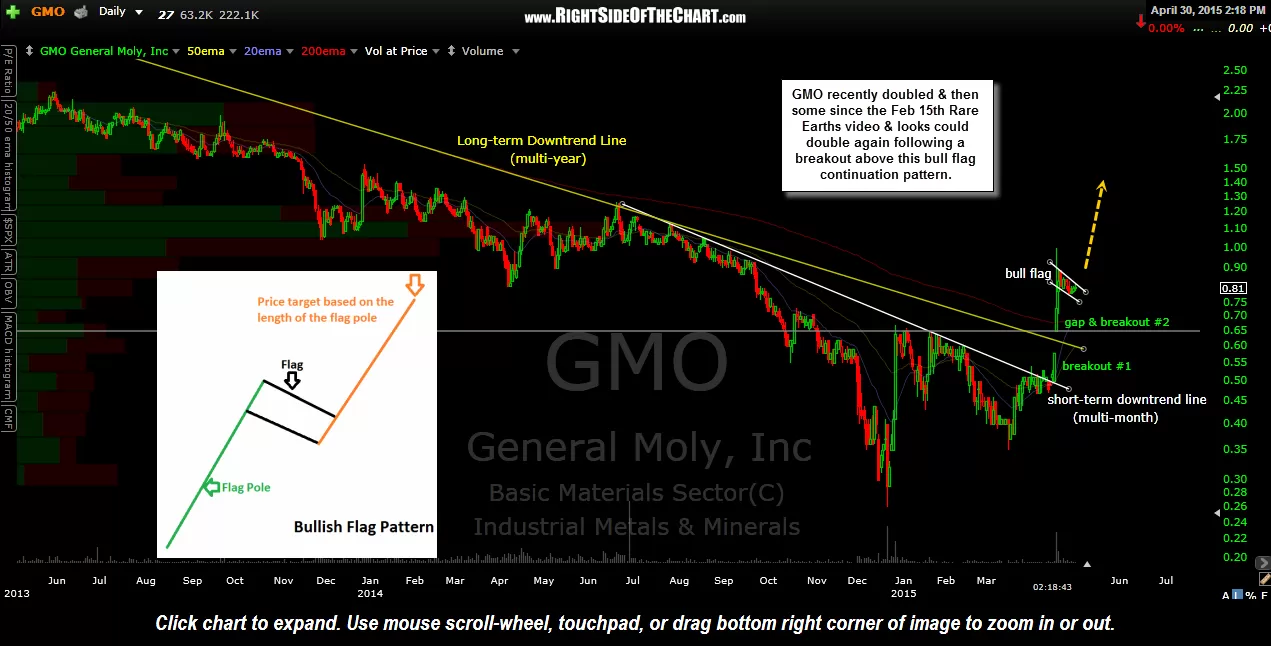
The first chart above is a screenshot from that video, followed by the updated weekly chart & the updated daily chart. I often find that little-watched, micro-cap stocks like GMO often do well during broad market sell-offs for whatever reason (and assuming the charts are bullish). Therefore, while I might normally avoid entering or adding to an existing position when the broad markets are under selling pressure, I most likely will add to GMO on a solid break above the bull flag continuation pattern that GMO has been consolidating within over the last couple of weeks on the daily time with a final price target around the 1.50 area.
Although GMO was mentioned as one of many trade ideas in the sector back then, it was not added as an official trade idea due to the near-term overbought nature of those stocks at the time the video was made. However, GMO will trigger a long entry (official trade idea) on a break above 0.86. Again, my ultimate swing target is around the 1.50 area, with a specific sell limit price (or multiple targets) TBD should GMO breakout & start another leg higher.
If you are not familiar with trading the Rare Earths, I strongly urge you to watch that video and take to heart the point about using a shot-gun approach (buying numerous rare earth producers vs. just one or two) and using a considerable downward adjustment in your position size to account for the extreme volatility in many of these stocks (think of them as the gold mining stocks on steroids). REMX (Rare Earths ETF) was also mentioned as an alternative or supplement to trading a basket of individual rare earth companies. REMX is also an Active Long (Swing) Trade as well as an Active Long-Term Trade Idea on the site. Previous notes & charts can be referenced via the symbol tagging system on RSOTC.