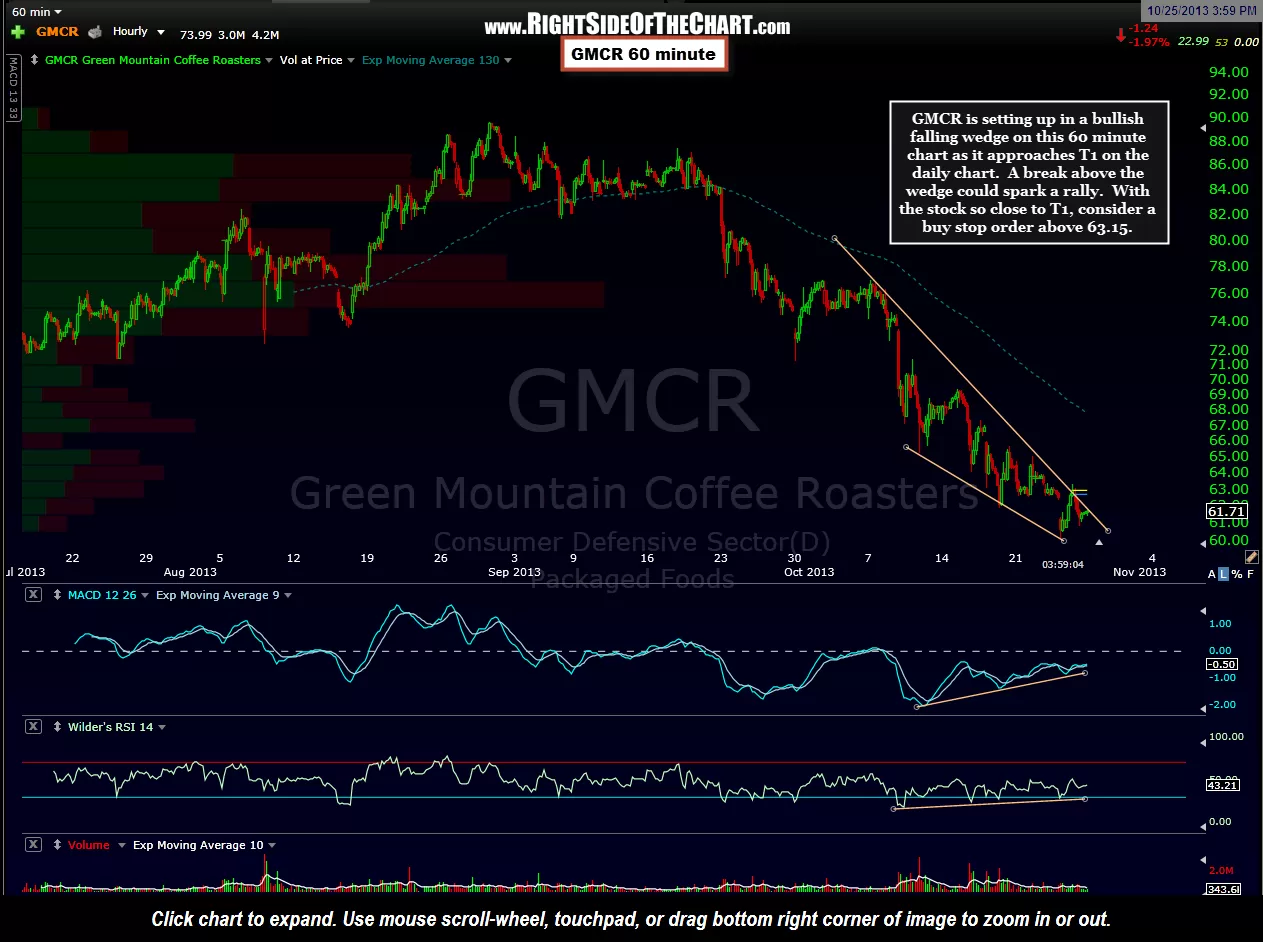
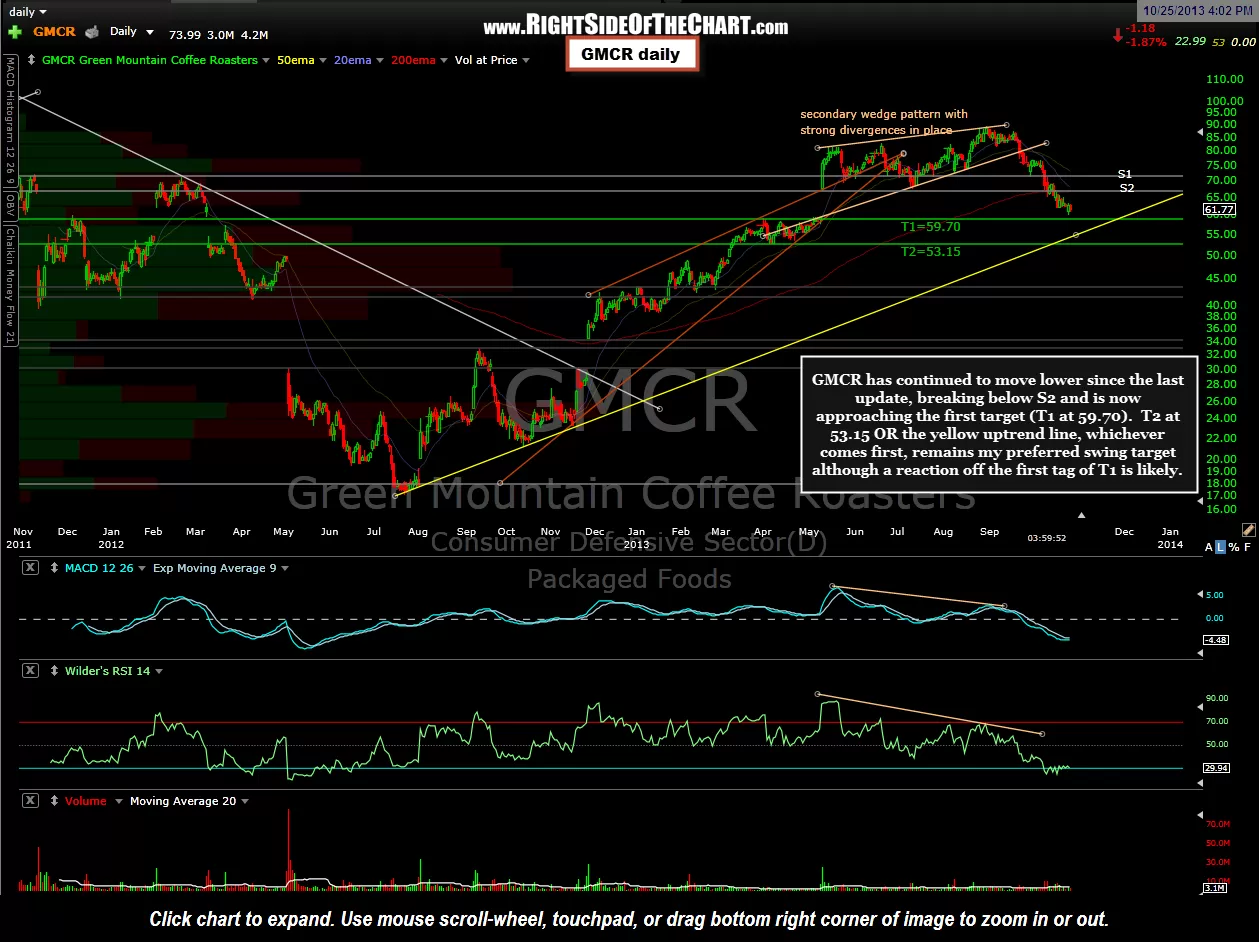
The GMCR short trade has continued to move lower since the last update, breaking below S2 and is now approaching the first target (T1 at 59.70). T2 at 53.15 OR the yellow uptrend line, whichever comes first, is my preferred swing target although a reaction off the first tag of T1 is likely. However, it is worth noting that the stock is setting up in a bullish falling wedge on this 60 minute chart as it approaches T1 on the daily chart. A break above the wedge could spark a rally. With the stock so close to T1, consider a buy stop order above 63.15 if you wish to protect profits. That level is slightly above yesterday’s gap down as well as yesterday’s close and should be just above any “fake-out” or false-breakout spike. Based on my interpretation of the charts, my best guess would be that if GMCR does break above the 60 minute falling wedge before the first target of 59.70 is hit, that the breakout would be sold into rather quickly (1-3 days) with prices continuing lower to backtest the wedge at a lower level, most likely around the 50.60ish/T1 area (targets are placed just above the actual support/expected bounce level on short trades). Updated daily & 60 minute charts.
-
- GMCR Daily Chart
-
- GMCR 60 Minute Chart