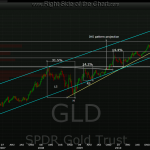
here’s the updated weekly chart to GLD (gold etf). currently, due in large part to the expected increase in volatility going forward, i prefer to use the weekly charts on some swing trade candidates for determining my stops. on this GLD weekly, i’d want to see a convincing close back into the channel (and possibly some other metrics to confirm). likewise, as far as maintaining my current short bias right now, i’d want to see the $SPX weekly make a solid trade above that key downtrend line before covering or tightening stops on my swing short positions.
from a fundamental perspective, i like the GLD short even more today as it is pretty apparent (just watch cramer foaming-at-the-mouth bullish right now) that there is a belief that the european crisis is quickly dissipating and that the US economy is now entrenched in a slow, albeit solid recover. what does that do the the gold bugs’ case that the gold is going to the moon due to global economic collapse and continued currency debasement by the central banks? keep in mind, my fundamental reasoning for any trade comes a distant second to the charts. 1st target remains that primary uptrend channel and my stops will be on or above (depending on other metrics at the time) a solid weekly close above the current trendline that GLD is re-testing. i might take the GLD short up to a full position today. updated weekly chart below:


