
A few great questions that I received today regarding gold/GLD, followed by my reply (with updated charts):
Q: Hi Randy, First, thanks for the great video on gold. I have a question about timing. So here we are sitting right on support with GLD again. At what point would you consider support lost? Do you look at the weekly close or the daily? Or is there some other indicator/level you watch?
On the other hand, RSI on the daily is about 31 as I type and as you have pointed out, once we dip below 30 gold and the miners by extension have been getting a bid. If it catches a bid, at what point do you start to enter? 1% above support? 2%? MACD curl up/cross?
I know it may not be as simple as just having 2 or 3 indicators agree and there is an “art” and “feel” to it but any advice would be greatly appreciated. Good luck and thanks for all of your instruction.
A: GLD is now trading at support on the daily chart which would essentially be the November lows (as well as the March lows which are slightly higher). Therefore, technically any move below 109.67 (the Nov 5th reaction low) is a break of that support level. However, although stocks, commodities, indices, etc.. sometimes bounce exactly off a support level, it is not unusual to see prices reverse just shy and even more common to see prices overshoot a well watched support level by a relatively small amount (often no more than a few percentage points).
Staying with the daily time frame, I show the RSI at 31.16 right now. If you look at those past oversold readings, each one dipped below the 30 level & based on the current price action, I think that gold/GLD is likely to continue a little lower until that happens once again.
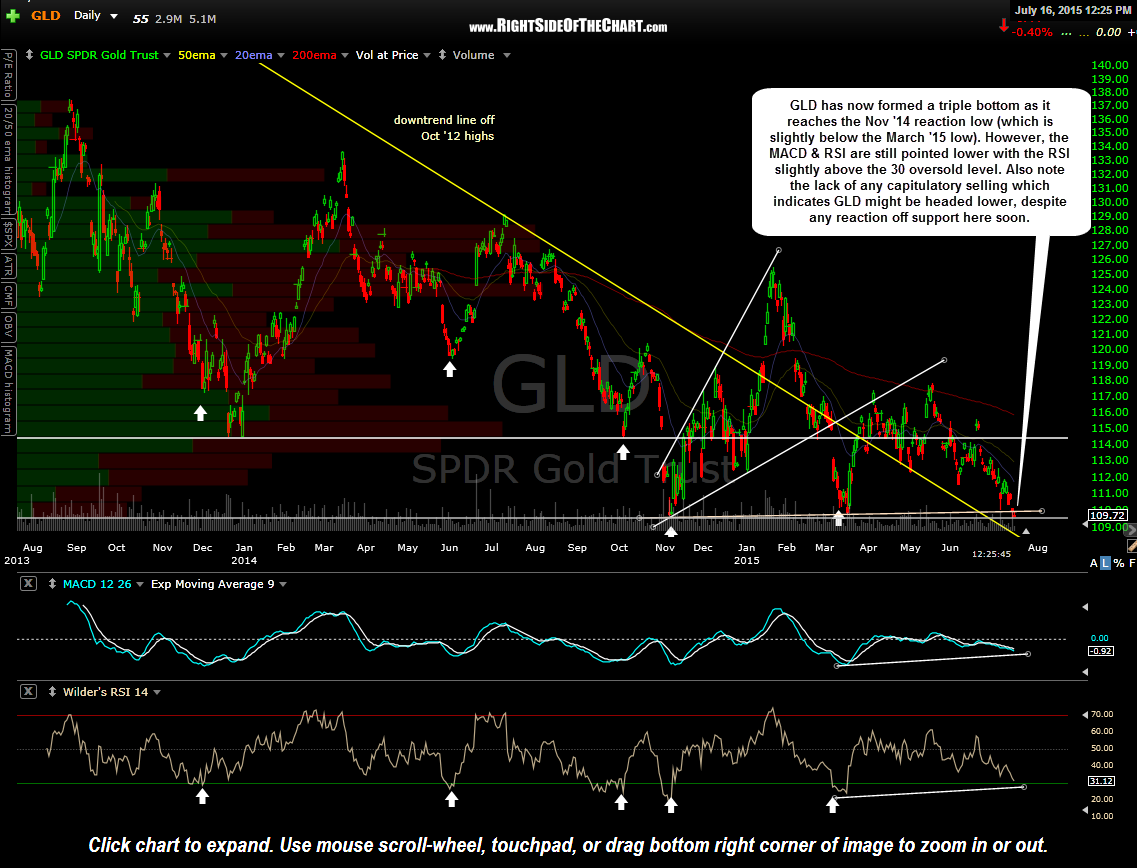
GLD daily July 16th
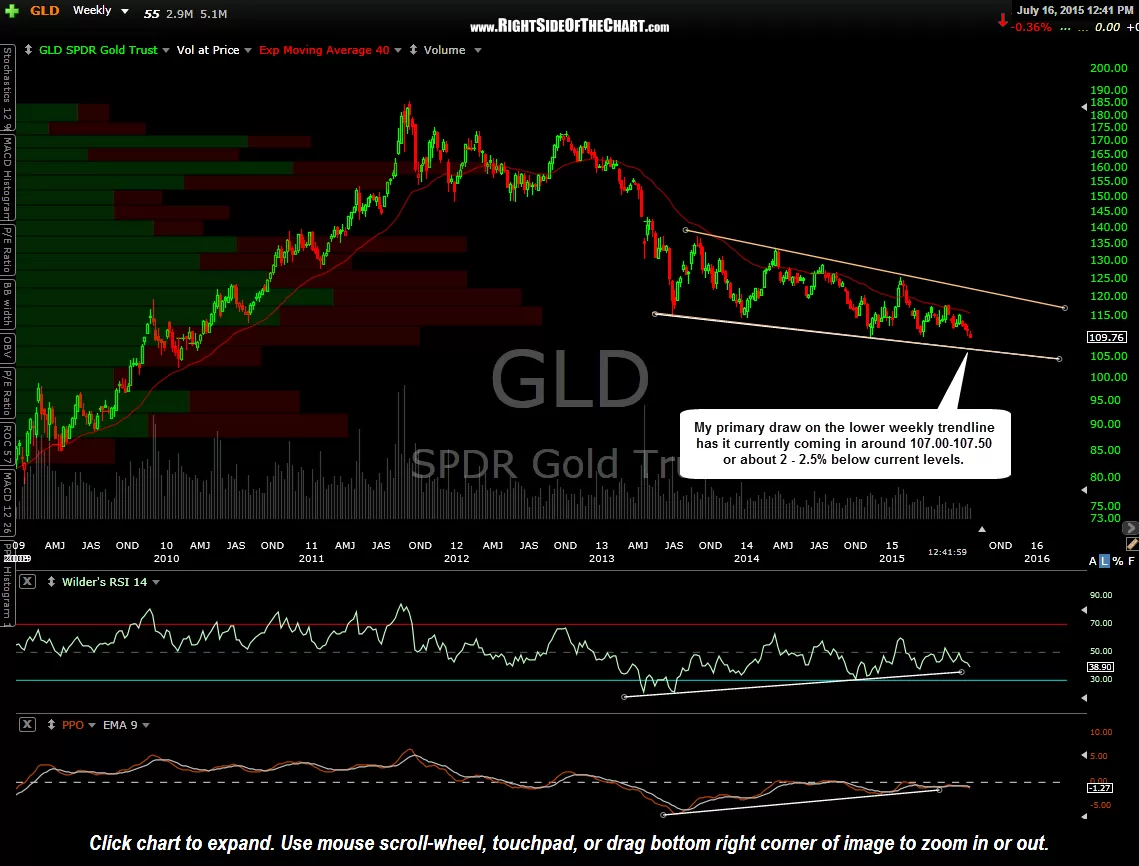
Zooming out to the weekly time frame, in the video I had highlighted that large, slightly descending wedge-type pattern that began with the late June 2013 reaction low. As of today, that lower support/downtrend line comes in around 107.50 (roughly) and as that is a down-sloping TL, that level drops slightly each week. A move down to tag that trendline would be my preferred buy point on GLD.
-

- GLD weekly July 16th
-

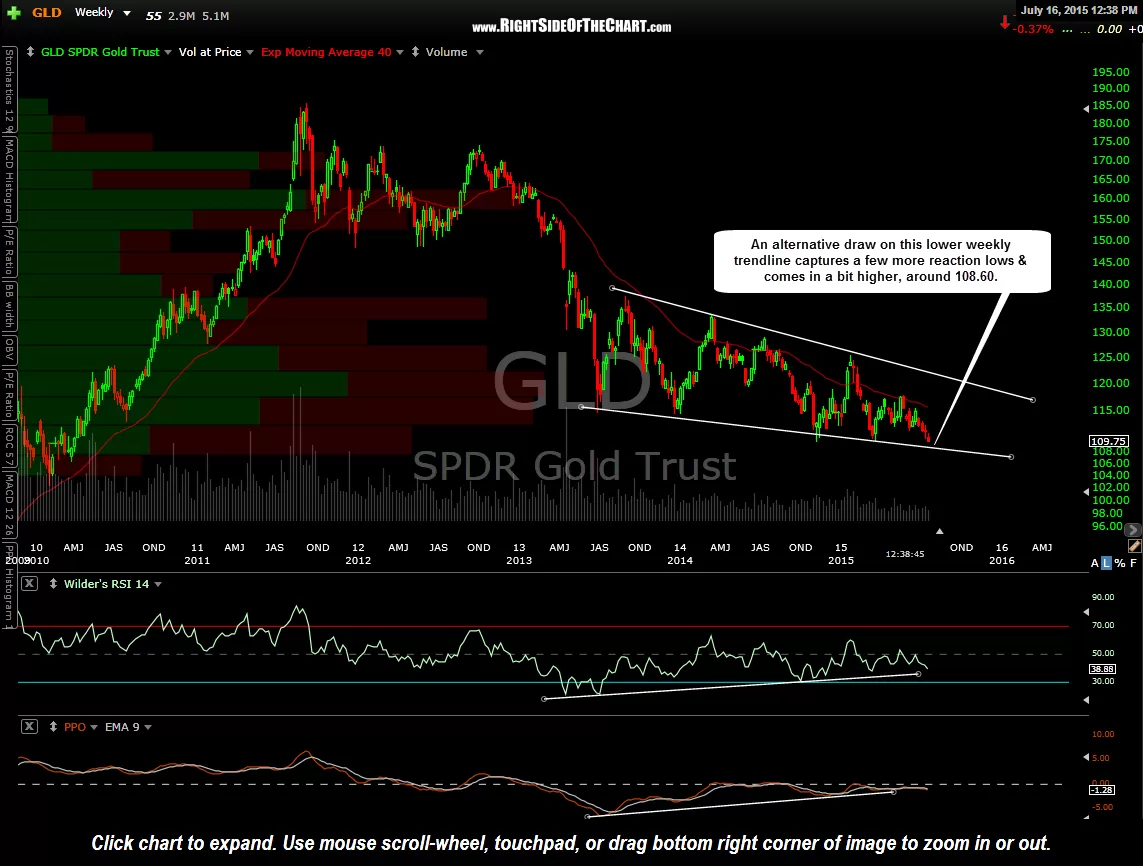
- GLD weekly 2 July 16th
However, with GLD/gold at a pretty decent support level on the daily time frame with prices very close to oversold, buyers could start stepping in at any time with the stock reversing. The markets have an uncanny way of fooling the masses so if the majority is looking to buy gold here at the daily support level, then GLD is likely to continue lower, shaking out those who take a full position here with a stop just below the November lows.
Therefore, one prudent strategy might be to start scaling into GLD here at the daily support, say a 1/4th position, adding to the position in ¼ lots over the next several weeks whether gold continues down towards that weekly support line OR reverses & begins to move higher soon, especially if confirmed by some sort of bullish price action such as a bull candlestick reversal pattern, etc… Also, as you said, I do like to see a bullish crossover, i.e. – the MACD start to curl up, which helps to confirm the positive divergence as right now, the daily MACD is still pointed lower along with the RSI.
One thing that is keeping me on the sidelines right now is the lack of any apparent capitulation in GLD. It would be nice to see several days of large, red (down) candlesticks accompanied by a surge in volume (selling climax/capitulation). That would be especially promising if it coincided with a move down to the 107ish level. In fact, even better would be a strong flush-out move down in GLD that takes out that weekly support line on an intraweek basis, only to see gold rally back to close the week above that support line, especially if it were to print a potential reversal candlestick in the process. At this time, I’m holding out for a little more downside in GLD before I start to scale in & I’m also starting to dig into the chart of the miners as I might focus on trading the most promising mining stocks in lieu of gold.