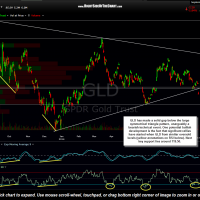
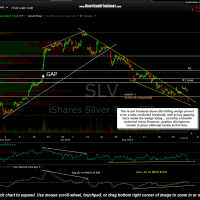
Both GLD (Gold ETF) and SLV (Silver ETF) experienced relatively large gaps below support today which can only be viewed as near-term bearish technical events. GLD has made a solid gap below the large symmetrical triangle pattern that was recently pointed out on the 4-hour time frame which is unarguably bearish price action. One potential bullish development is the fact that significant rallies on GLD have started from similar oversold levels (see the yellow annotations on RSI below). Next key support lies around 119.50.
- GLD 4 hour Sept 2nd
- SLV 60 minute Sept 2nd
Along with the symmetrical triangle pattern on GLD, I had also pointed out this bullish falling wedge pattern on the 60 minute chart of SLV, which prices broke above last week. Today’s gap down in SLV sent prices back well within the wedge pattern which makes last week’s breakout a “fakeout” or failed breakout. Failed breakouts are also clearly bearish technical events that are often followed up with additional selling. However, it is certainly worth noting that SLV still has bullish divergences in place on both the MACD & RSI (on the same 60 minute time frame previously shown). Therefore, it could be argued that we have some “glass half-empty or half-full?”, bearish vs. bullish cross-currents in the near-term technicals for both gold & silver.
For now the longer-term outlook on both remains bullish but both gold & silver are not far from very critical long-term support levels which, if broken, would certainly dampen the case that a new bull market in gold & silver is underway. My plan regarding the exposure that I recently added back to the mining sector is to sit tight on my positions for now and watch to see if GLD & SLV follow through to the downside following today’s bearish price action or not. Keep in mind these are only intraday charts although the 4-hour symmetrical triangle on GLD is also on the daily time frame.


