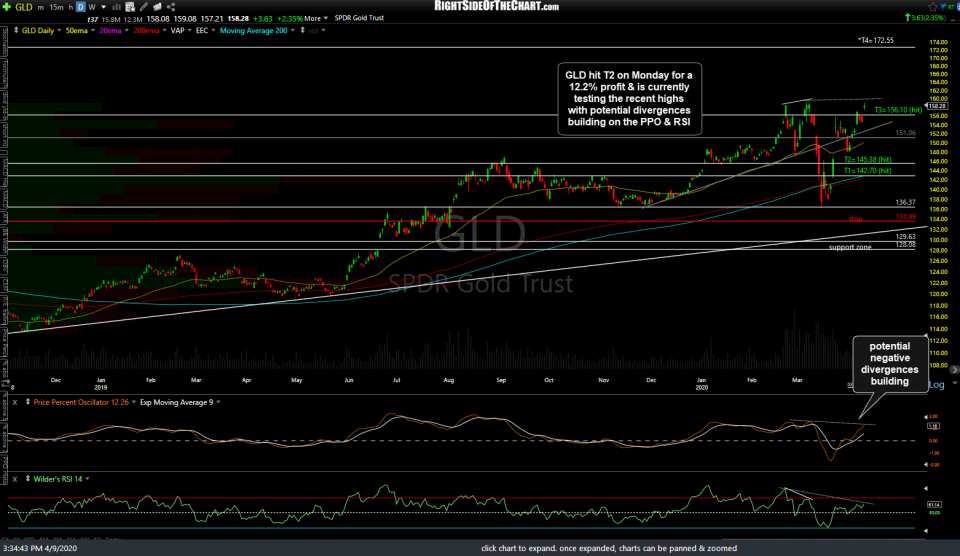
As previously highlighted in one of the videos earlier this week, the GLD (gold ETF) Active Long Swing Trade + Long-Term Trade idea hit the third price target, T3 at 156.10, for a 12.2% profit on Monday. T4 (172.55) remains the final target at this time although there are some additional developments worth pointing out at this time.
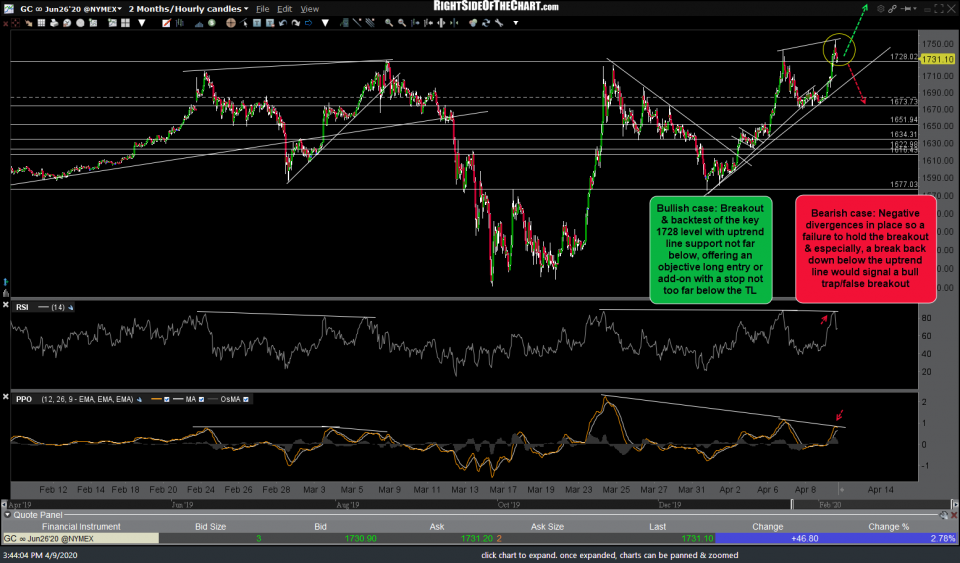
Essentially, we have some technical cross-currents on GLD at this time. In the 60-minute chart of /GC posted earlier today, I highlighted the fact that /GC (gold futures) were testing key resistance around the 1728 level which has capped all advances in recent months, stating that a solid break above that level could open the door to the next leg higher in the larger bull market that gold has been in since bottoming in late 2015.
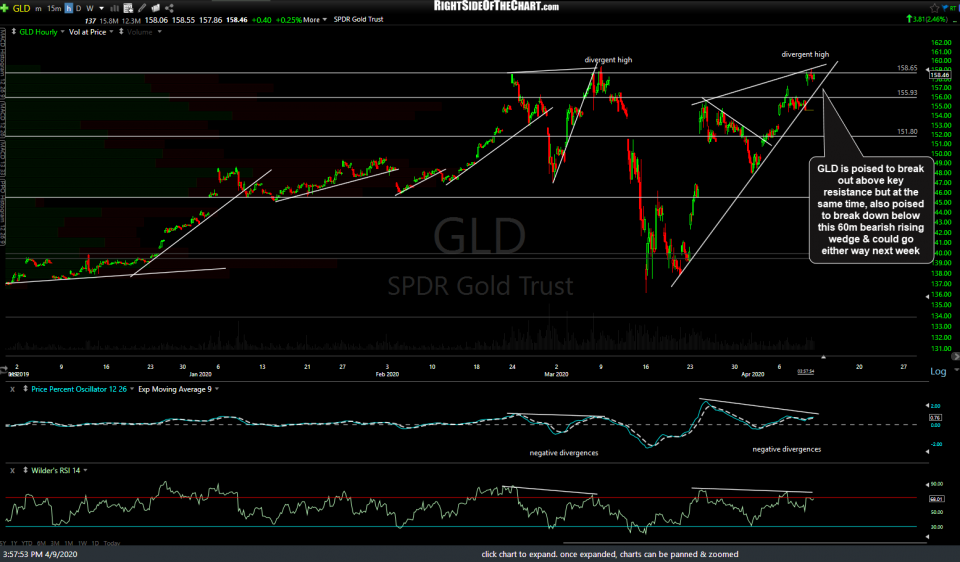
While that still remains a possibility, I should also point out the potential negative divergences that have been building on both the 60-minute as well as the daily charts of /GC & GLD. Typically, breakouts to new highs that occur with negative divergences in place have a significantly higher failure rate that breakouts that occur without divergences. I wish I could say with a high degree of confidence which way gold breaks from here but I can’t at this time. As such, best to watch these levels (price & trendline support just below) and see how GLD trades next week, as the stock market is closed tomorrow for Good Friday (although we can also watch /GC gold futures trade going forward for a preview of things to come next week).


