
After running into resistance (dashed blue uptrend line), $GOLD (spot gold prices) are now backtesting the neckline of the late 2014/early 2015 Inverse Head & Shoulders bottoming pattern. As former resistance, the neckline became support once gold prices broke above the pattern. As such, this backtest of support provides an objective long entry or add-on to gold or gold related positions with the appropriate stops in place somewhat below.
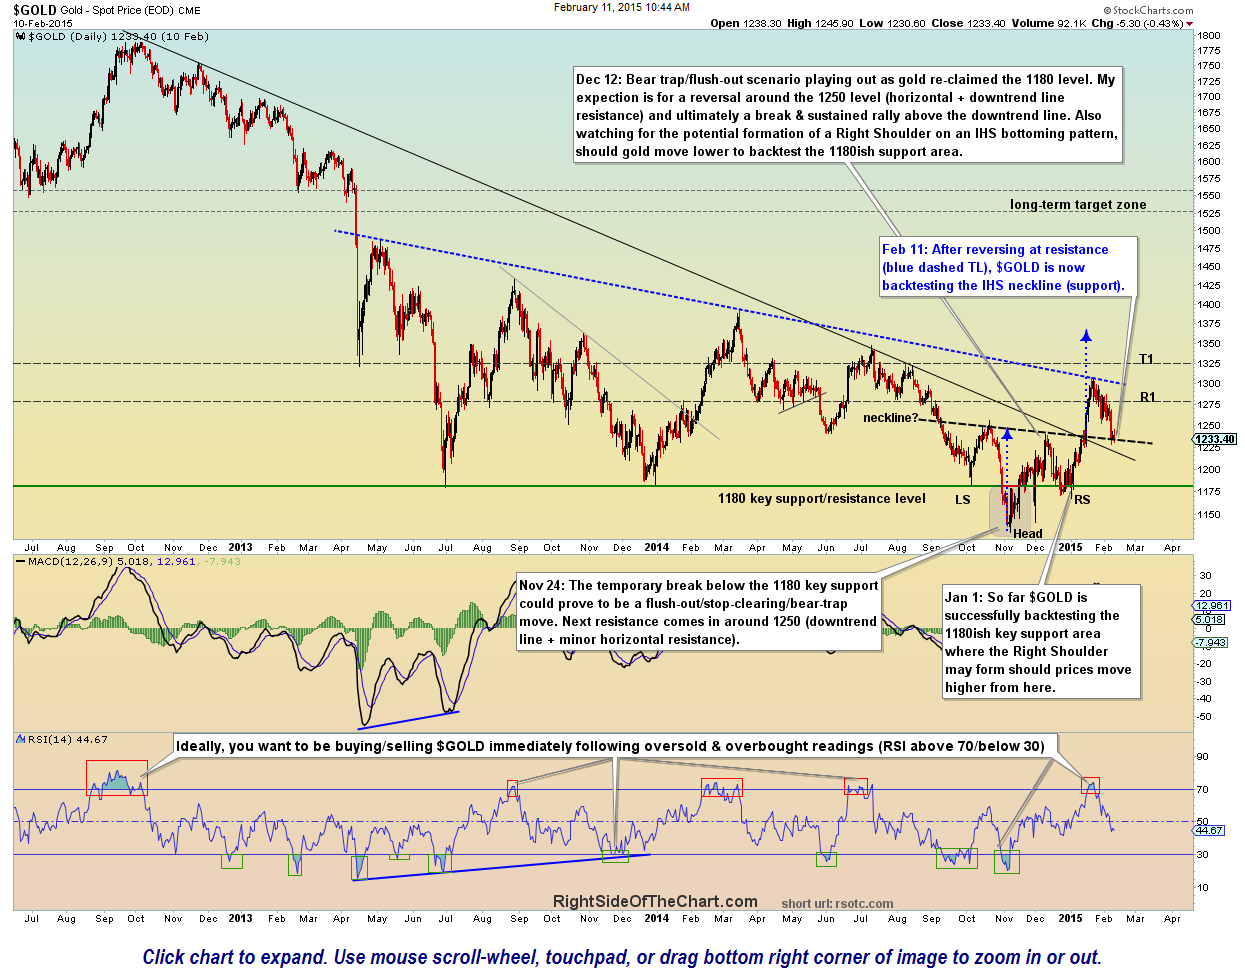
$GOLD daily Feb 11th
From another perspective, looking at the daily chart of GLD (gold etf) below we can see that gold is also close to backtesting this recent broken multi-year downtrend line (also now support) from above.
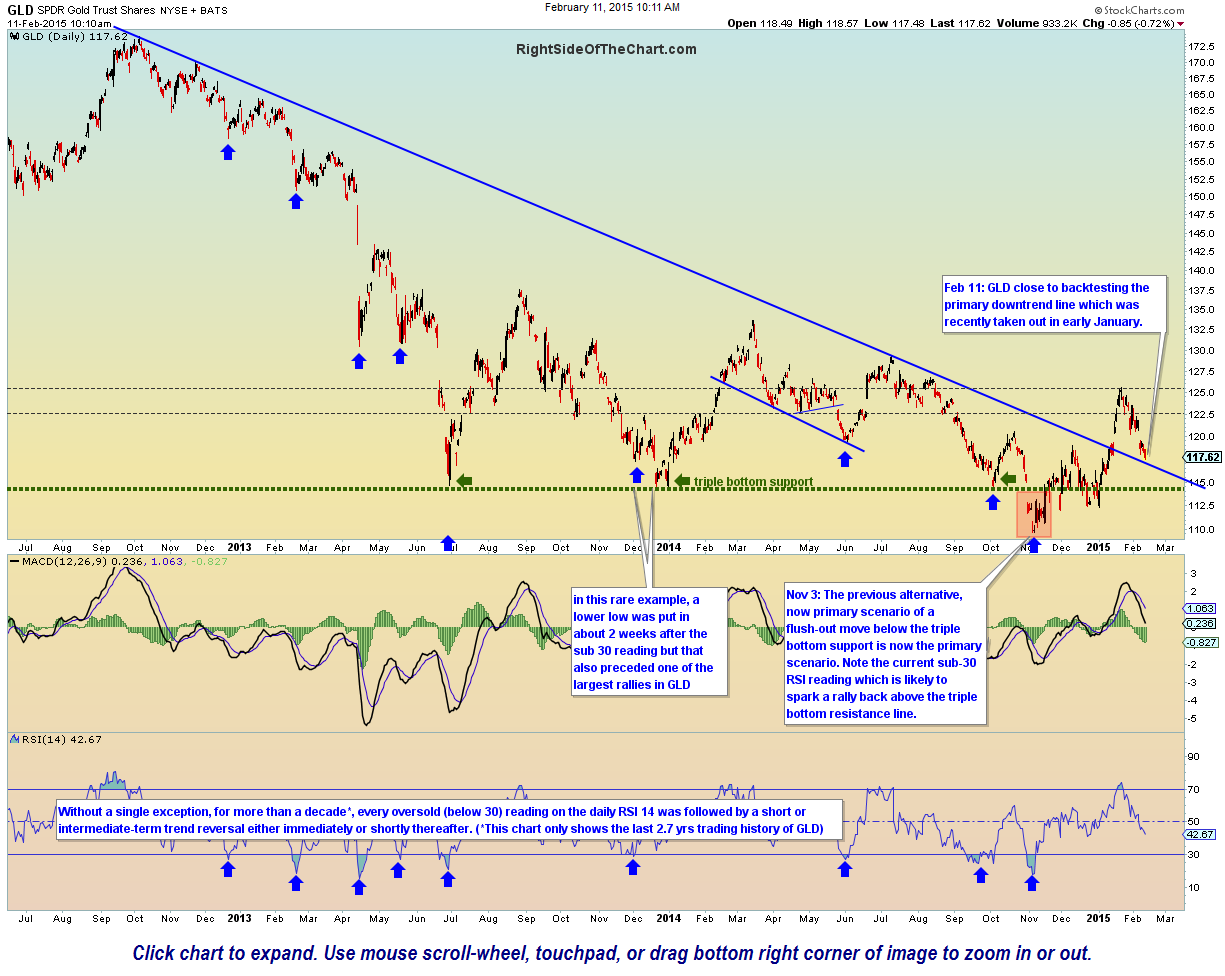
GLD daily Feb 11th
Zooming down to a 2-hour time frame, GLD has now pulled back to a Fibonacci cluster (potential support) within the Ascending Broadening Wedge pattern that was highlighted over the last couple of months. Although I would prefer to see some bullish divergence in place on the 60-minute+ time frames in order to build the case for a reversal, nonetheless GLD still offers an objective entry based on this partial decline within the pattern with relatively tight stops (under 116.50-116.80) and an ultimate upside target of new highs in GLD (swing targets TBD). Another option for more active traders would be a long here with a quick bounce target of just below the 126.28 resistance level (about 2.5% above) with a trailing stop of 0.8% or lower.
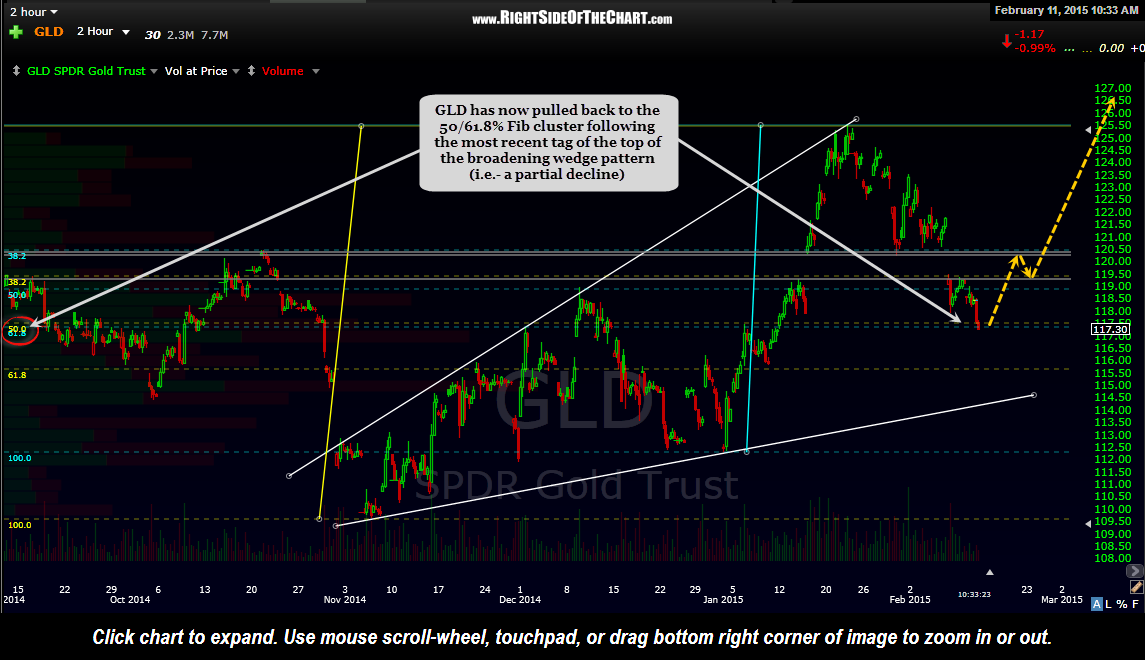
GLD 120-min Feb 11th
Last but not least is the daily chart of GDX (Gold Miners ETF) which highlights the recently discussed “W” bottoming pattern. GDX has various support levels (better viewed on the intraday charts) running from around the current price of 20.90, all the way down to around the 21.00 level. However, with gold current at or just above support, my expectation would be for the gold mining sector to reverse closer to the high-end of that range than the lower end.
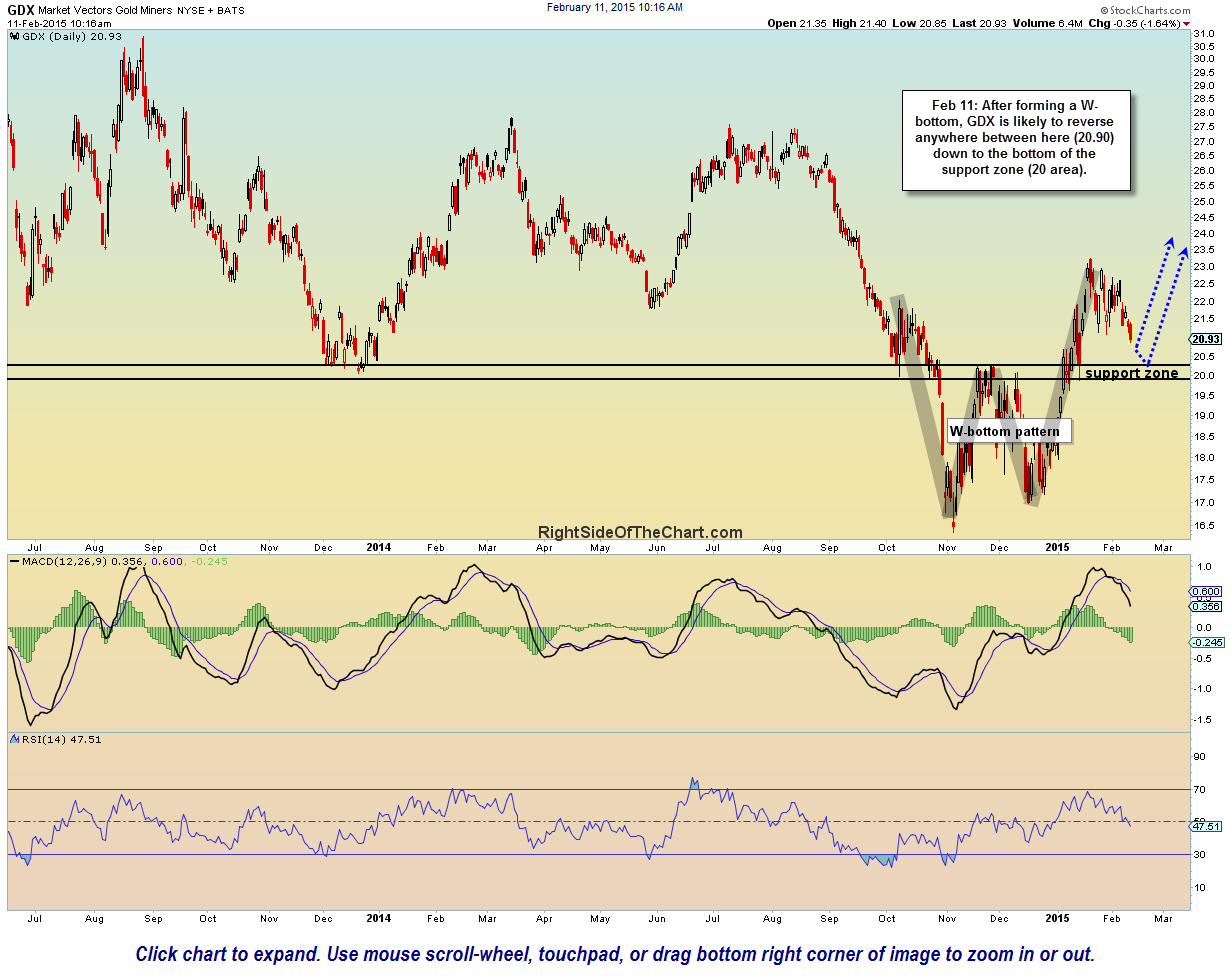
GDX daily Feb 11th