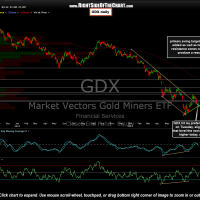
The chart and my thoughts on GDX pretty much mirror that of the SIL trade posted below. As with SIL, GDX (gold miners etf) hit my preferred pullback target on Tuesday, the yellow solid uptrend line on the updated daily chart (second chart). The first chart below was posted on July 24th, the day after the miners peaked.
As with SIL, I have added the profit targets to this chart along with a couple of resistance zones that may come into play before then, should any more active traders prefer to micro-manage their positions around those levels. Consider raising stops to slightly below yesterday’s lows.


