
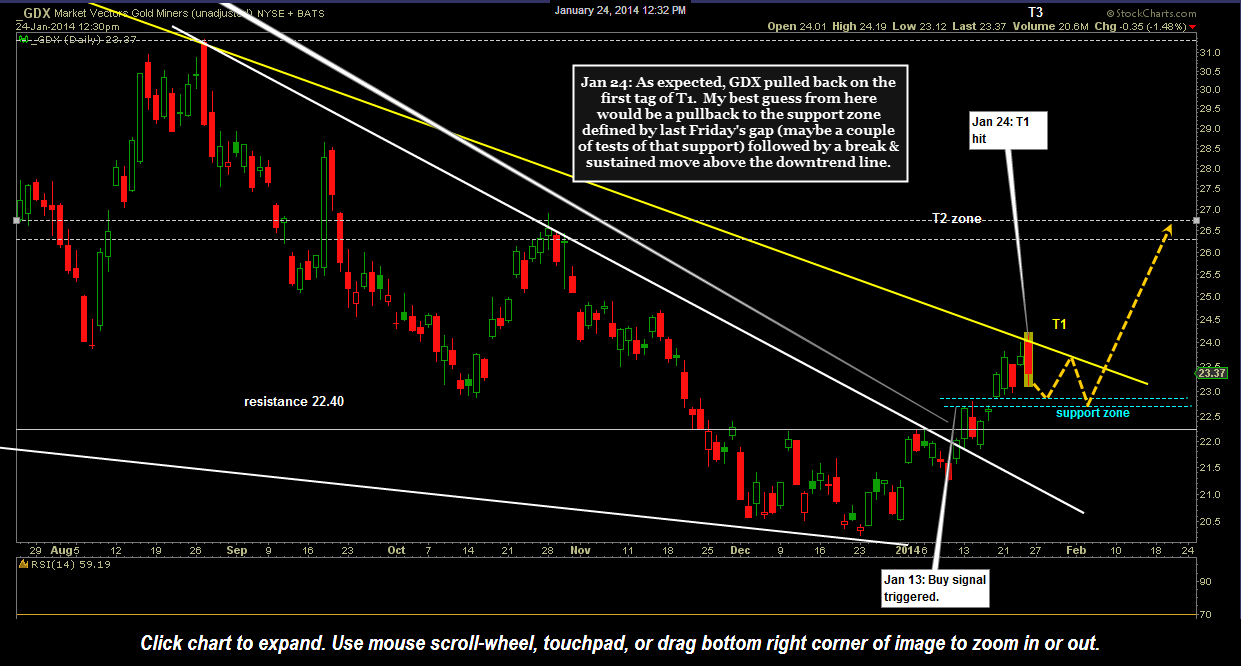
GDX daily Jan 24th scenario
As expected, GDX pulled back on the first tag of T1, which was the yellow downtrend line. My best guess from here would be a pullback to the support zone defined by last Friday’s gap (maybe a couple of tests of that support) followed by a break & sustained move above the downtrend line. Therefore, any pullback to the 22.95 area would be an objective area to start adding back exposure to GDX. The top of the gap is actually 22.85 but with a lot of traders watching the charts on GDX right now, as evidenced by today’s reversal off the downtrend line, I would not be surprise to see GDX reverse just above the actual support level. Of course GDX could just also fall to the bottom of the gap, which would also provide an objective entry. A relatively tight stop on either (or both, if buying the top & bottom of the gap) could be place somewhat below anywhere from the 22.50 level down to the 22.oo level (or lower, depending on your cost basis if you’ve been scaling in over the last month or so). This static chart is a zoom-in of the GDX daily chart illustrating my preferred scenario (a pullback/consolidation to support in order to work off the near-term overbought conditions, leading to a sustained breakout above the downtrend line). Click here for the GDX live chart.