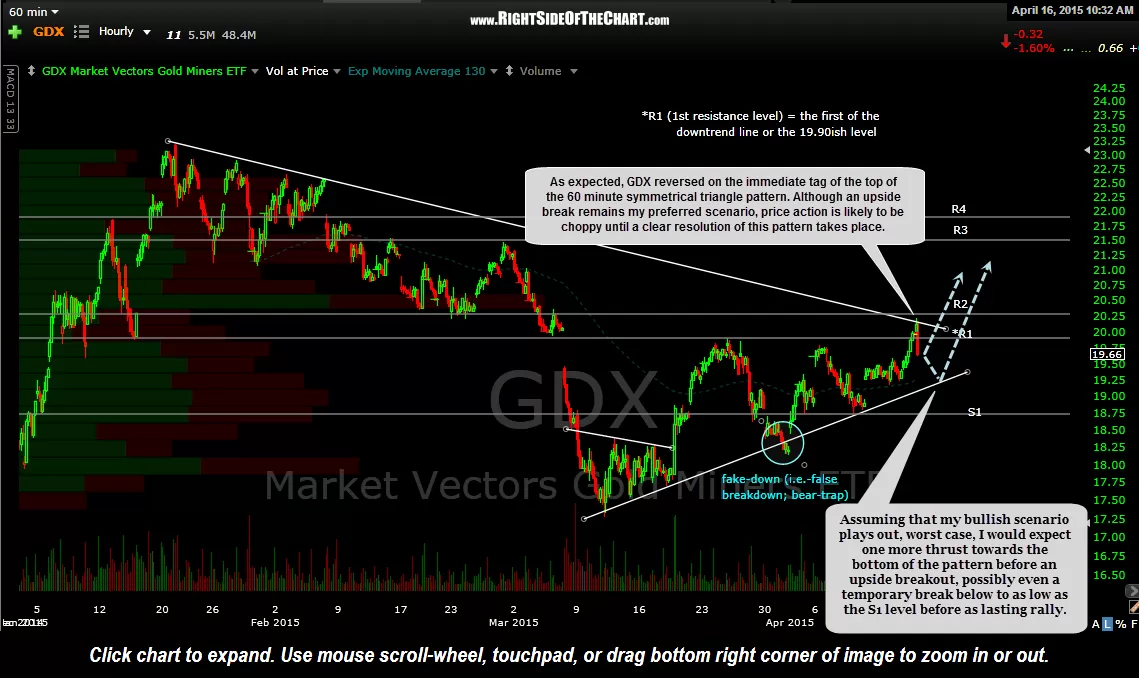
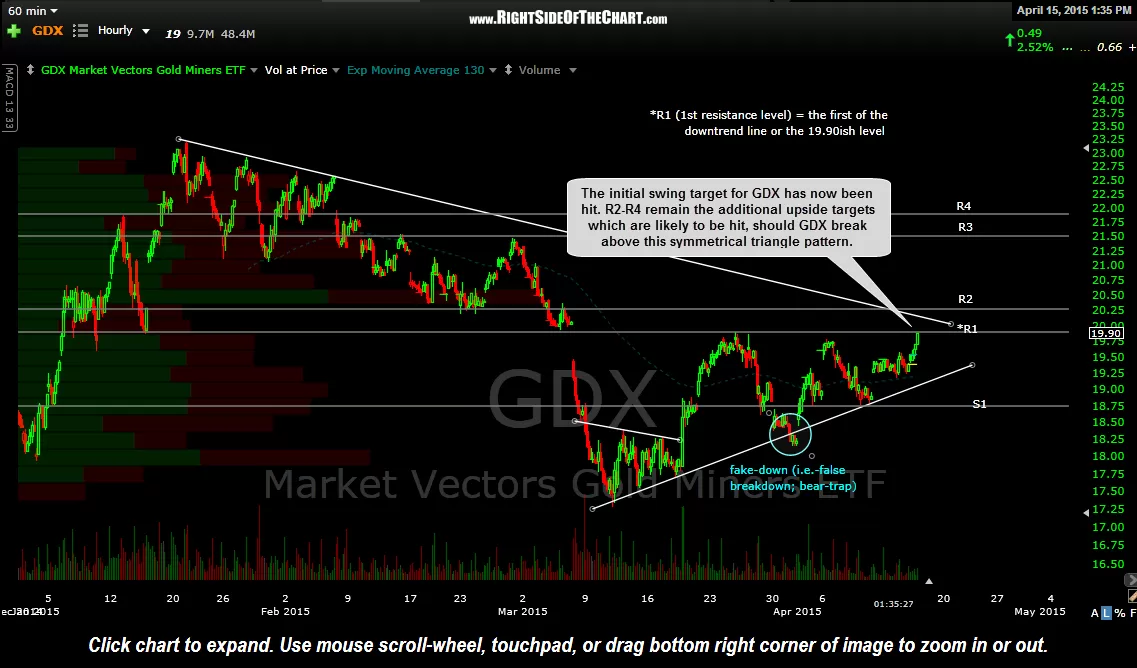
As expected, GDX reversed on the initial tag of the top of the 60 minute symmetrical triangle pattern. Although an upside break of the pattern remains my preferred scenario, price action is likely to be choppy until a clear resolution of the triangle occurs. Assuming that my bullish scenario plays out, worst case, I would expect one more thrust towards the bottom of the pattern before an upside breakout, possibly even a temporary break below to as low as the S1 level before as lasting rally.
The bottom line is that the near-term outlook for GDX is a bit unclear at this time and as such, I plan to keep things light with the mining stocks for now. Longer-term investors need not be overly concerned with the near-term noise on GDX other than maybe to strategically add to the mining sector at objective levels such as a pullback to the bottom of this pattern and or the S1 level as well as a solid upside break above the triangle pattern.
Included below is the most recent string of 60-minute charts on GDX that were post highlighting this symmetrical triangle pattern along with my preferred scenario of how the GDX trade would play out over the last couple of weeks. (click on first chart to expand, then click anywhere on the right of each chart to advance to the next chart).
-
- GDX 60 minute April 3rd
-
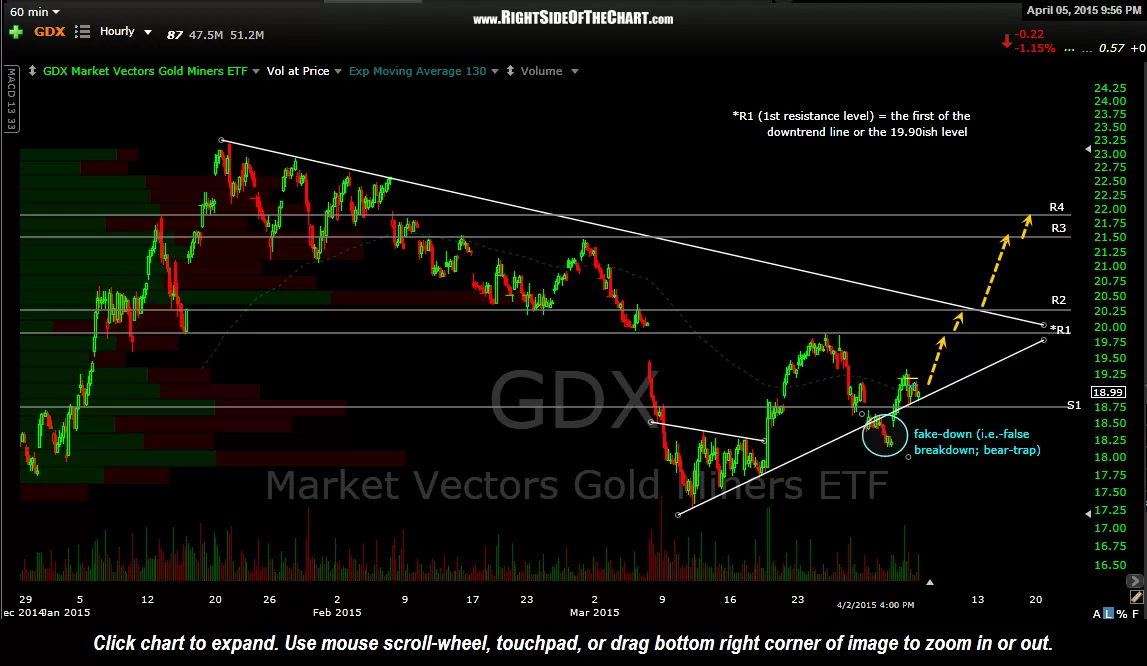
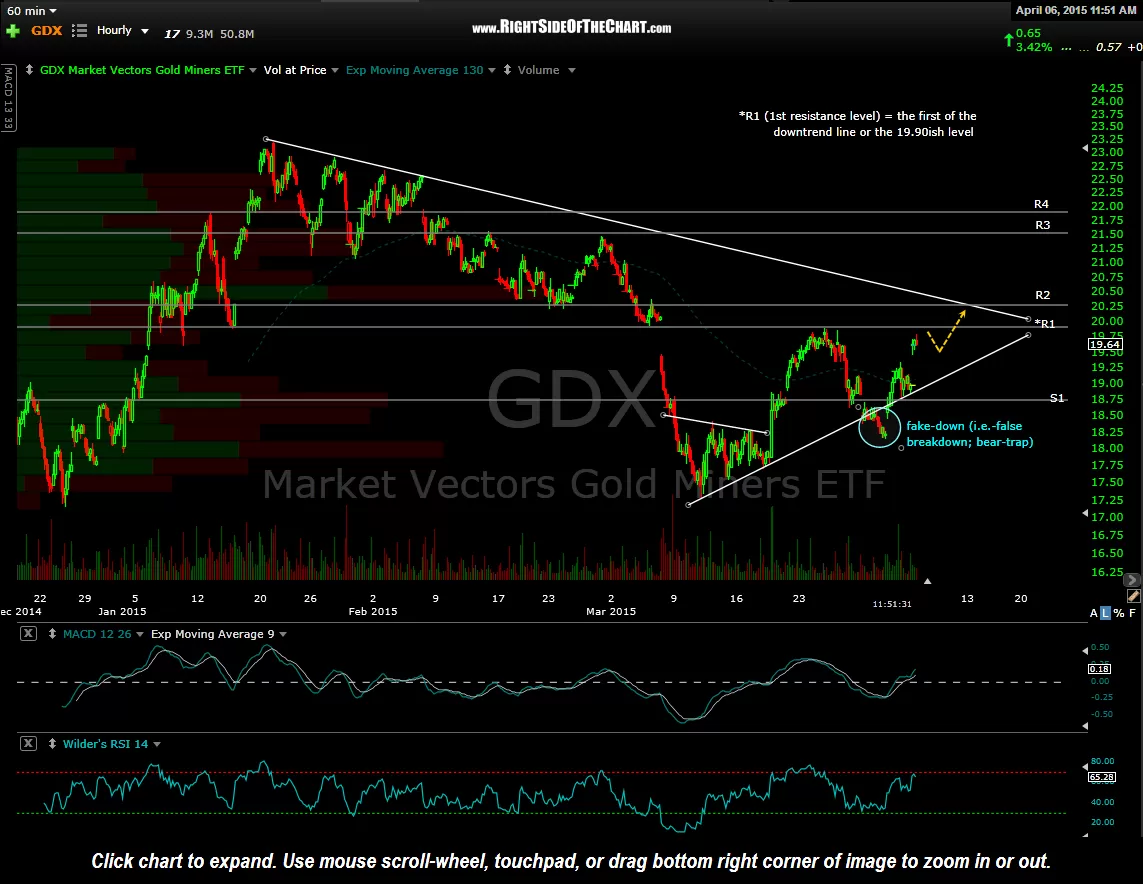
- GDX 60 minute April 6th
-
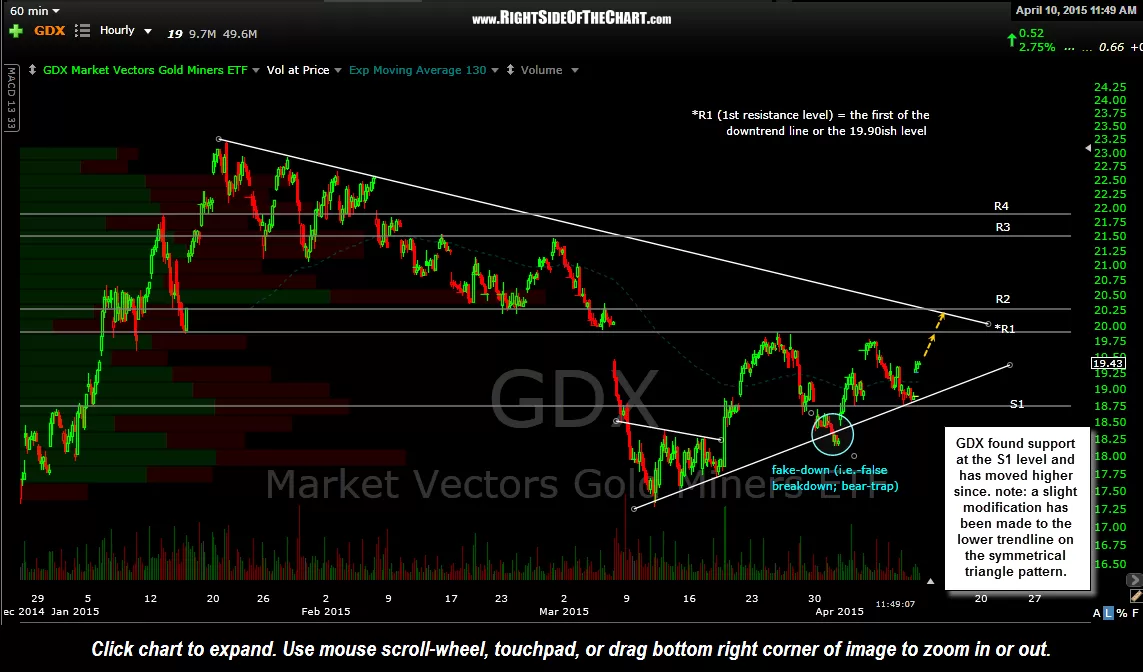
- GDX 60 minute April 10th
-
- GDX 60 minute April 15th
-
- GDX 60 minute April 16th