
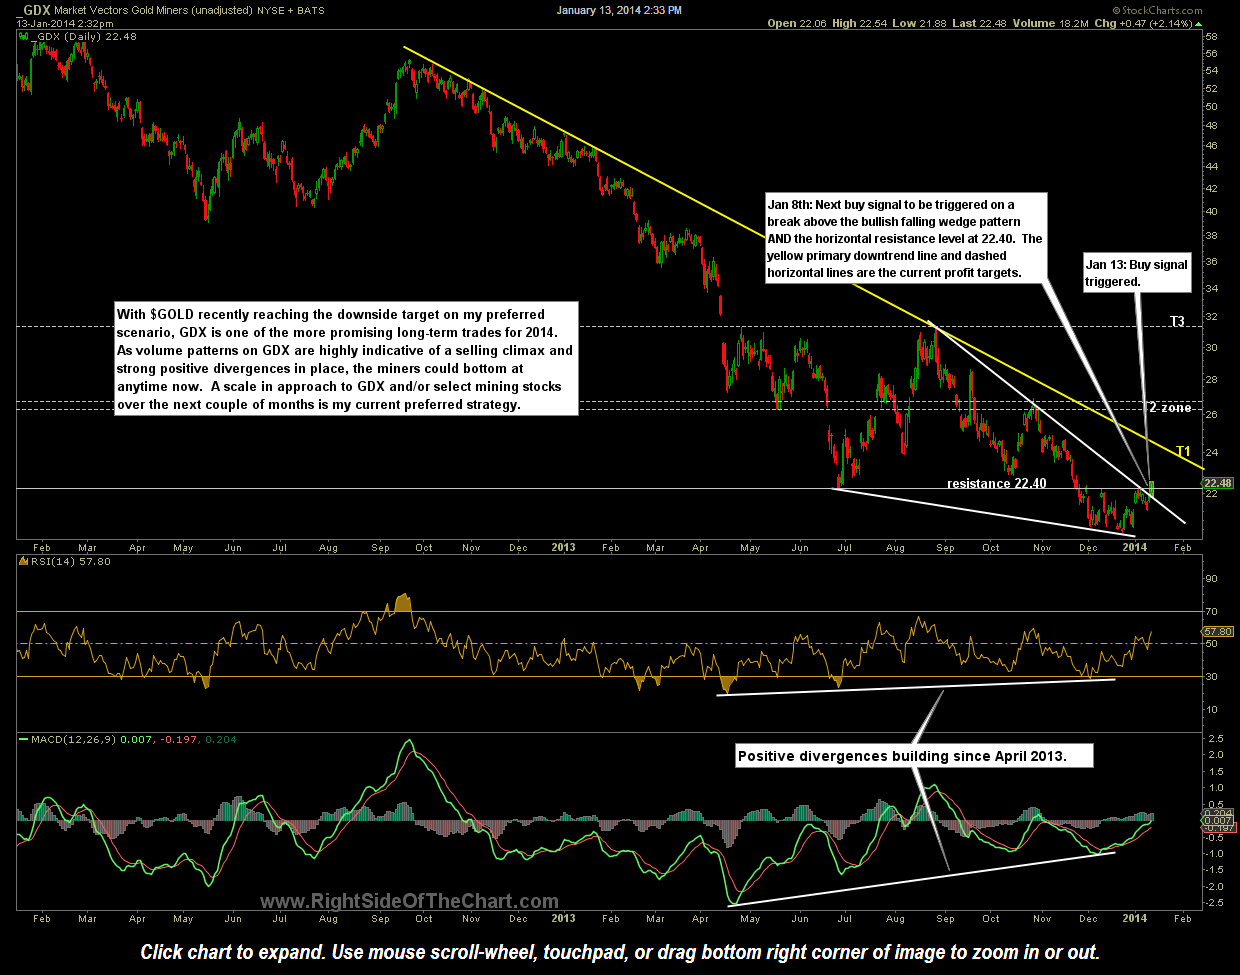
GDX daily Jan 13
GDX (Market Vectors Gold Miners ETF) has triggered the next buy signal which was previously stated as a break above both the bullish falling wedge pattern AND the 22.40 resistance level. With the recent strength in the mining sector and the sheer number of individual mining stock trade ideas (11 so far, excluding GDX & SIL, all listed in the Live Charts Link page), I will not be able to publish updates on all significant technical developments such as breaks above resistance, pullbacks to support, etc… but I will do my best to keep the live charts as up-to-date as possible. As always, any significant changes to the previous charts, such as target revisions, will be posted right away. Click here to view the live chart of GDX.