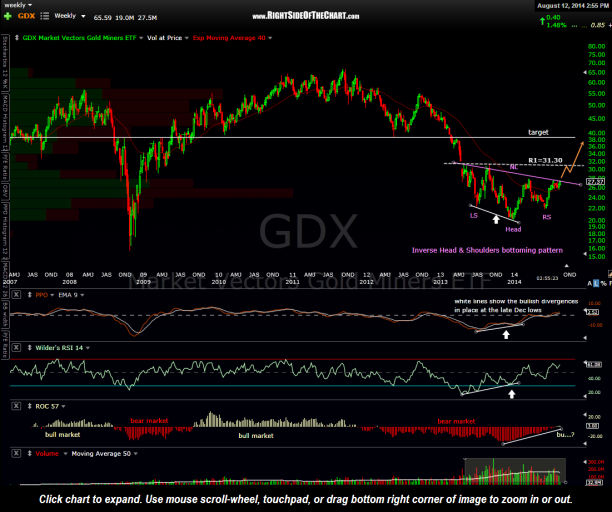
The Inverse Head & Shoulders bottoming pattern on the GDX (Gold Miners ETF) is now fully formed with volume patterns confirming this potentially powerful reversal pattern. With prices currently up against the neckline, any solid weekly close above the pattern would trigger a long-term buy signal for the miners although my preference will be to see any breakout of this IHS pattern confirmed by a bullish breakout in GLD, as per the recently discussed criteria. My price target, should both GDX and GLD confirm the long-term buy signals, would be the 38.50-39.00 area with the first and only major resistance area before then expected to come in around the 31.30ish area. As such, should both GLD & GDX trigger these long-term buy signals, my expectation would be to see the miners play out per this scenario drawn with the orange lines: A sharp move towards the 31.30 area, followed by a tradeable pullback off that resistance area, then followed by one final thrust up to the 38.50-39.00 target area.
Astute Ellioticians might notice how well this scenario fits into a basic 5 wave sequence with wave 1 (up) starting from the Dec 31st lows (i.e.-bottom of the head), wave 2 down being the move from the NL down to the bottom of the right shoulder, wave 3 up in progress now and to be continued until the 31.30sih pullback target (and yes, wave 3 would measure as the most powerful wave, should the pullback (wave 4) be relative minor as expected), and finally followed by a 5th wave up to hit the final target area of 38.50-39.00.
Sounds almost too perfect and as I always say, predicting future price moves is a lot like forecasting the weather; the cone of accuracy widens along with the time period of the forecast. e.g.- Mr. Weatherman can tell you with a fair degree of accuracy the chance of rain tomorrow and throughout the week as well as the expected temperatures but not so much what conditions will be like 3-6 months from now. As with weather forecasting, a market technician must continually revises and adjust his/her expectation of where prices are headed as the data (chart/price action) changes over time.
One final note to add: Assuming gold continues to move higher and this IHS pattern on GDX goes on to breakout soon, one variation to this scenario would be to allow for the possibility of a backtest of the neckline shortly following the breakout, a fairly common occurrence.


