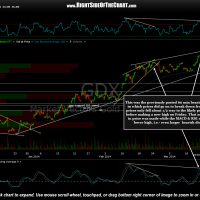
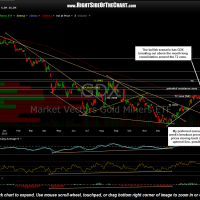
I received the following question regarding GDX & as I had been meaning to post an update on the gold mining sector, I will share my reply along with a couple of updated charts:
Question: Hi,I haven’t seen a post from you regarding GDX and the recent rally. Am I right that your previous 60 min bear wedge is not valid and is now potentially replaced by yet another bigger BW and a slightly larger GDX correction. I’d curious to find out how you see this recent GDX push higher. Thanks.
Reply: Yes, That’s pretty much how I see it. Prices did move above the previous highs on the 60 min rising wedge that I had drawn and although that was not my expectation, it is not very uncommon to see prices make an additional high after breaking down from a rising wedge pattern before moving meaningfully lower.
You are also correct that GDX is now forming what appears to be an even larger bearish wedge as even larger, potentially more powerful negative divergences have been put in place on Friday’s new high. That would be the bearish case and the one that I still favor although I have to say that the trend in the miners is very strong and with the miners still in the relatively early stages of what might be a new bull market, any corrections are likely to be relatively minor & short-lived.
The bullish case, which is best viewed on the daily chart, has GDX consolidating for nearly one full month after hitting my second target (T2) zone before making an impulsive breakout of that range (which has the appearance of a bull flagging continuation pattern) on Thursday. Maybe GDX will continue to follow through on that breakout although my gut tells me to hold off before adding back exposure to the miners as there is a good chance that last week’s breakout is likely to prove to be a bull-trap.
Updated 60 minute & daily charts below. Click here to view the live daily chart of GDX.
- GDX 60 minute March 17th
- GDX daily March 17th
[/fusion_builder_column][/fusion_builder_row][/fusion_builder_container]


