
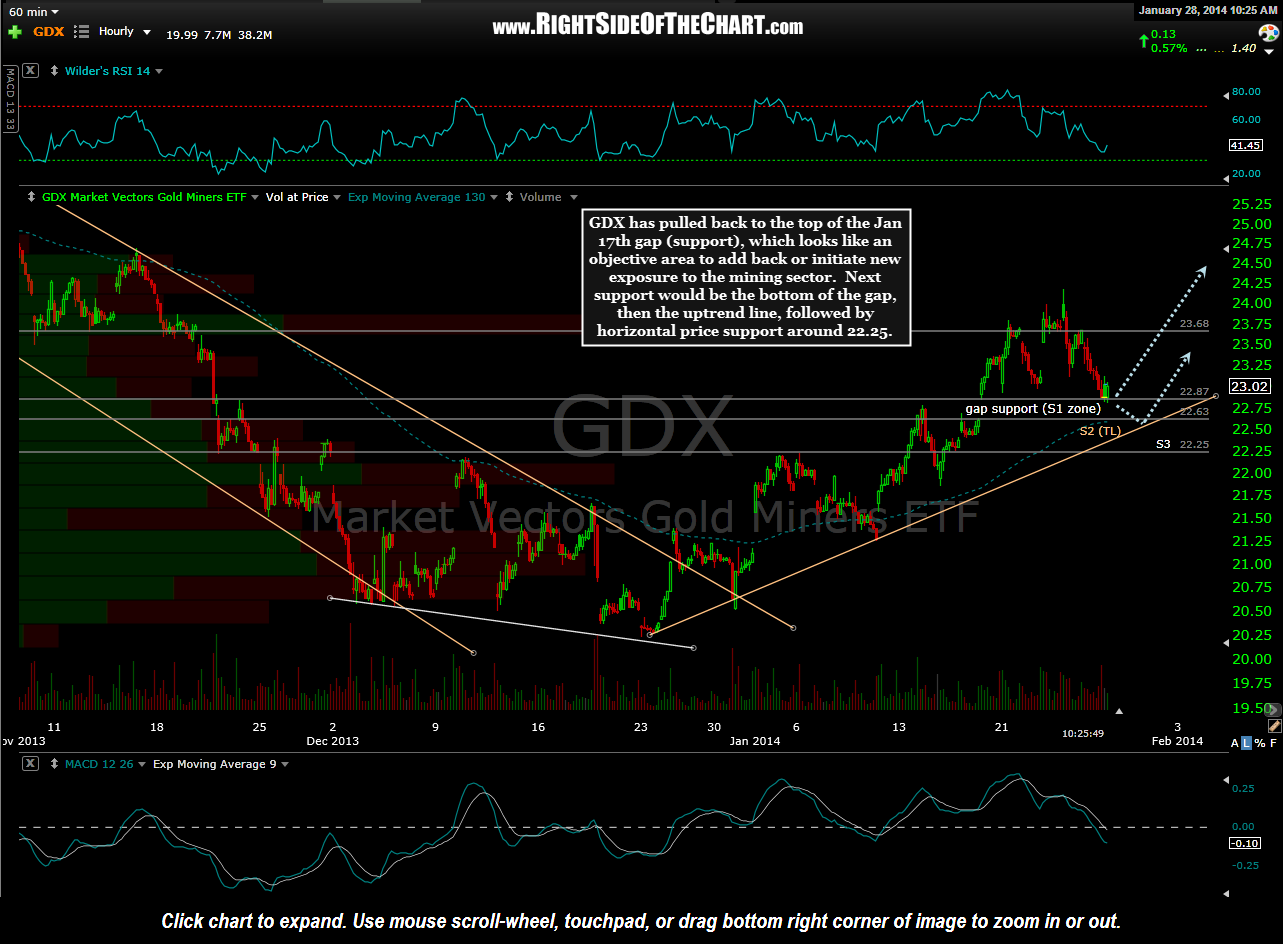
GDX 60 minute Jan 28th
GDX has pulled back to the top of the Jan 17th gap (support), which looks like an objective area to add back or initiate new exposure to the mining sector. Next support would be the bottom of the gap, then the uptrend line, followed by horizontal price support around 22.25. The static 60 minute chart shown.