
I won’t have much to report on GLD (gold etf) until the end of the week. As I had stated before, any intraweek break below the aforementioned weekly support line was not only possible but welcomed, assuming that GLD manages to regain & close on or above the top of that weekly support line by the end of the week (Friday market close). I should also reiterate that in the recent July 10th video on gold, it was stated that a wash-out move all the way down to around the 98-98.80ish level (and possibly as low as the 94.45 level which is the bottom of that Fib cluster & horizontal support zone highlighted in the video) was also discussed a possibility & a very welcomed one at that. As such, I stand by my original plan to only take a partial position on gold until/unless GLD manage to print a weekly close back on or in the pattern & I will most likely close my partial positions in gold & select miners, should GLD fail to do so by the end of the week.
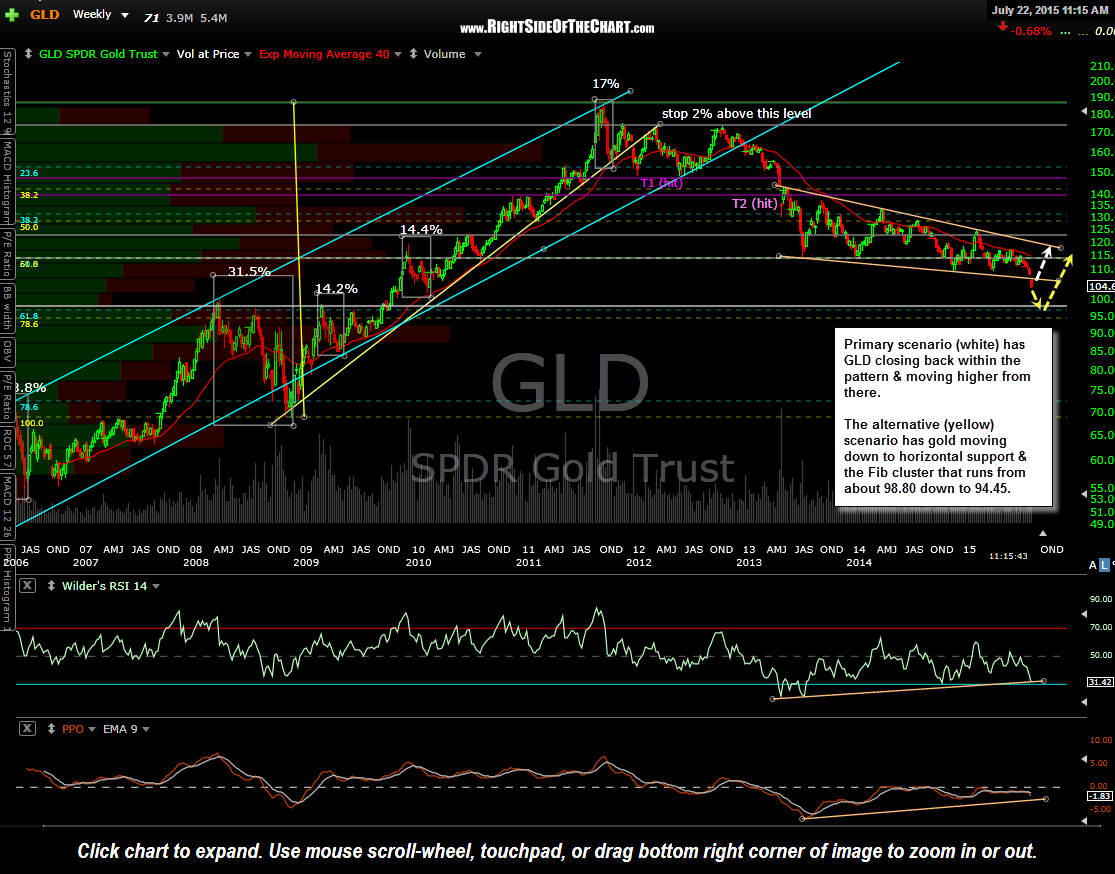
GLD weekly July 22nd
Taking a look at GDX (gold miners ETF), we can see that the miners are now trading at the bottom of the large descending broadening wedge pattern on the weekly time frame with the weekly RSI trading below 30 (oversold) for only the forth time in over a decade. The white arrows show all oversold readings in the last decade+, each followed by a significant rally or bull market. The big question is just how long will the current oversold conditions persist before the miners bottom?
The 2009 & 2014 oversold reading resulted in near-immediate reversals whereas the 2013 readings came months before the bottom. As such, more conservative traders & investors might choose to wait for a cross back over the 30 level on the weekly RSI before establishing a long position while aggressive traders might consider taking a partial position here with the appropriate stops in place below, only adding to the position on strength, not weakness.
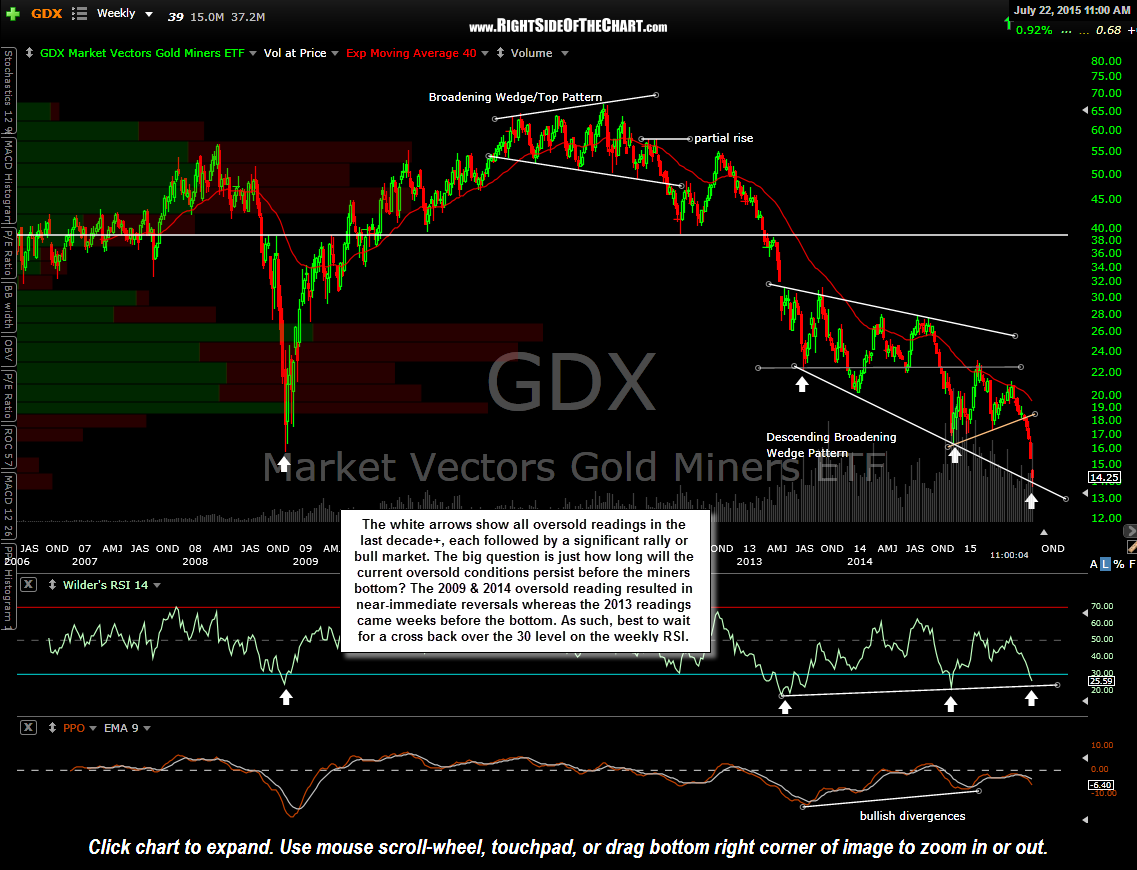
GDX weekly July 22nd