
GDX (Gold Miners ETF) just kissed the bottom of the 60-min symmetrical triangle pattern. Although a brief break below is quite likely, a GDX long entry here with a stop below 18.70 (to allow for a brief whipsaw break below the pattern) offers an objective entry with a nice R/R. Upside price target remain R2 – R4 (resistance levels).

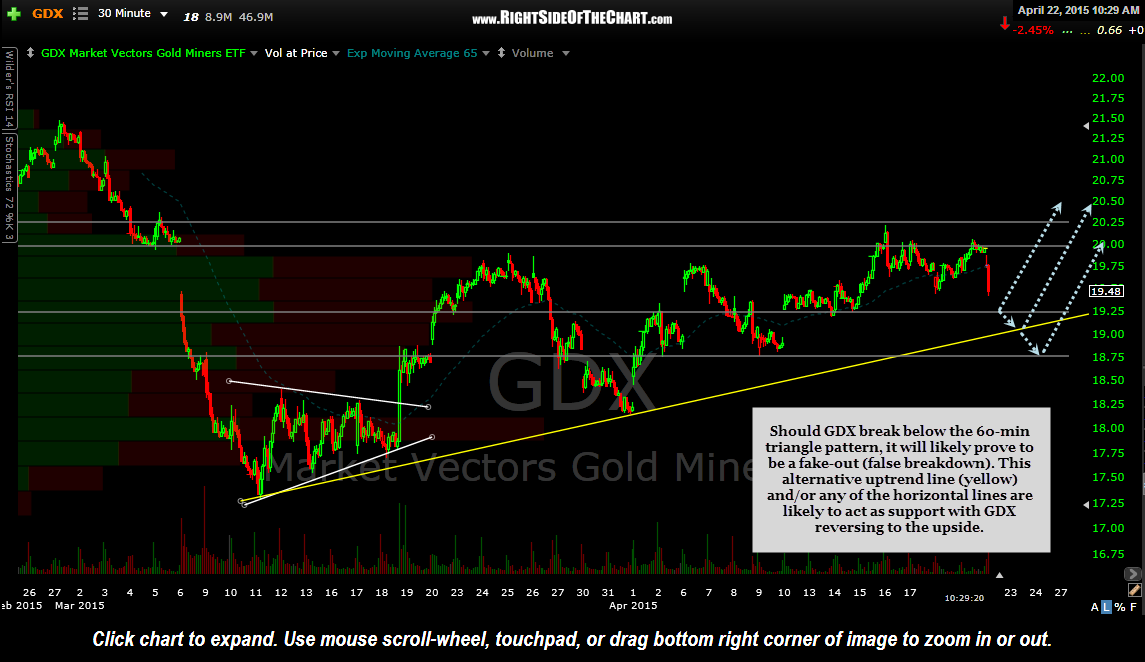
GDX 60 minute April 22nd
Should GDX break below the 60-min triangle pattern, it will likely prove to be a fake-out (false breakdown). This alternative uptrend line (yellow) and/or any of the horizontal lines are likely to act as support with GDX reversing to the upside.
GDX 15 minute April 22nd