
I’ve had some requests for analysis on Bitcoin recently & while I’m not crazy about it, I do think the case can be made for an aggressive long entry here at mild-to-moderate support. I will also add that the odds of a tradable rally in Bitcoin in the coming weeks to months will quite likely depend on whether or not my current expectation for a likely rally in the stock market pans out or not. Bitcoin has been a “risk-on” trade for a while now, meaning that it tends to rally during risk-on environments (i.e.- when the stock market was rallying) and more so falling hard once the Fed-induced risk-on bubble popped late last year with Bitcoin topping right along with the tech/risk-on heavy Nasdaq late last fall.
The first chart below is the $BTC/USD daily chart showing Bitcoin falling to what I would describe as mild-to-moderate (but not solid) support around 20,800. I’ve also noted what I referred to as an ADL or almost-divergent-low as prices have made a much lower low while the PPO & RSI “almost” made equal lows, which would be a divergent low, although the indicators, at this time, have made slightly lower lows. I’ve seen similar technical postures on other securities where ADL’s or AHD’s (..highs) did end up playing out for a trend reversal just as a typical divergent high or low would have. Of course, as with the stock market, we have ZERO buy signals & Bitcoin is solidly entrenched in one of the most powerful downtrends in its relatively short history. As such, pass on this “catch a falling knife” trade if that is not your cup of tea.
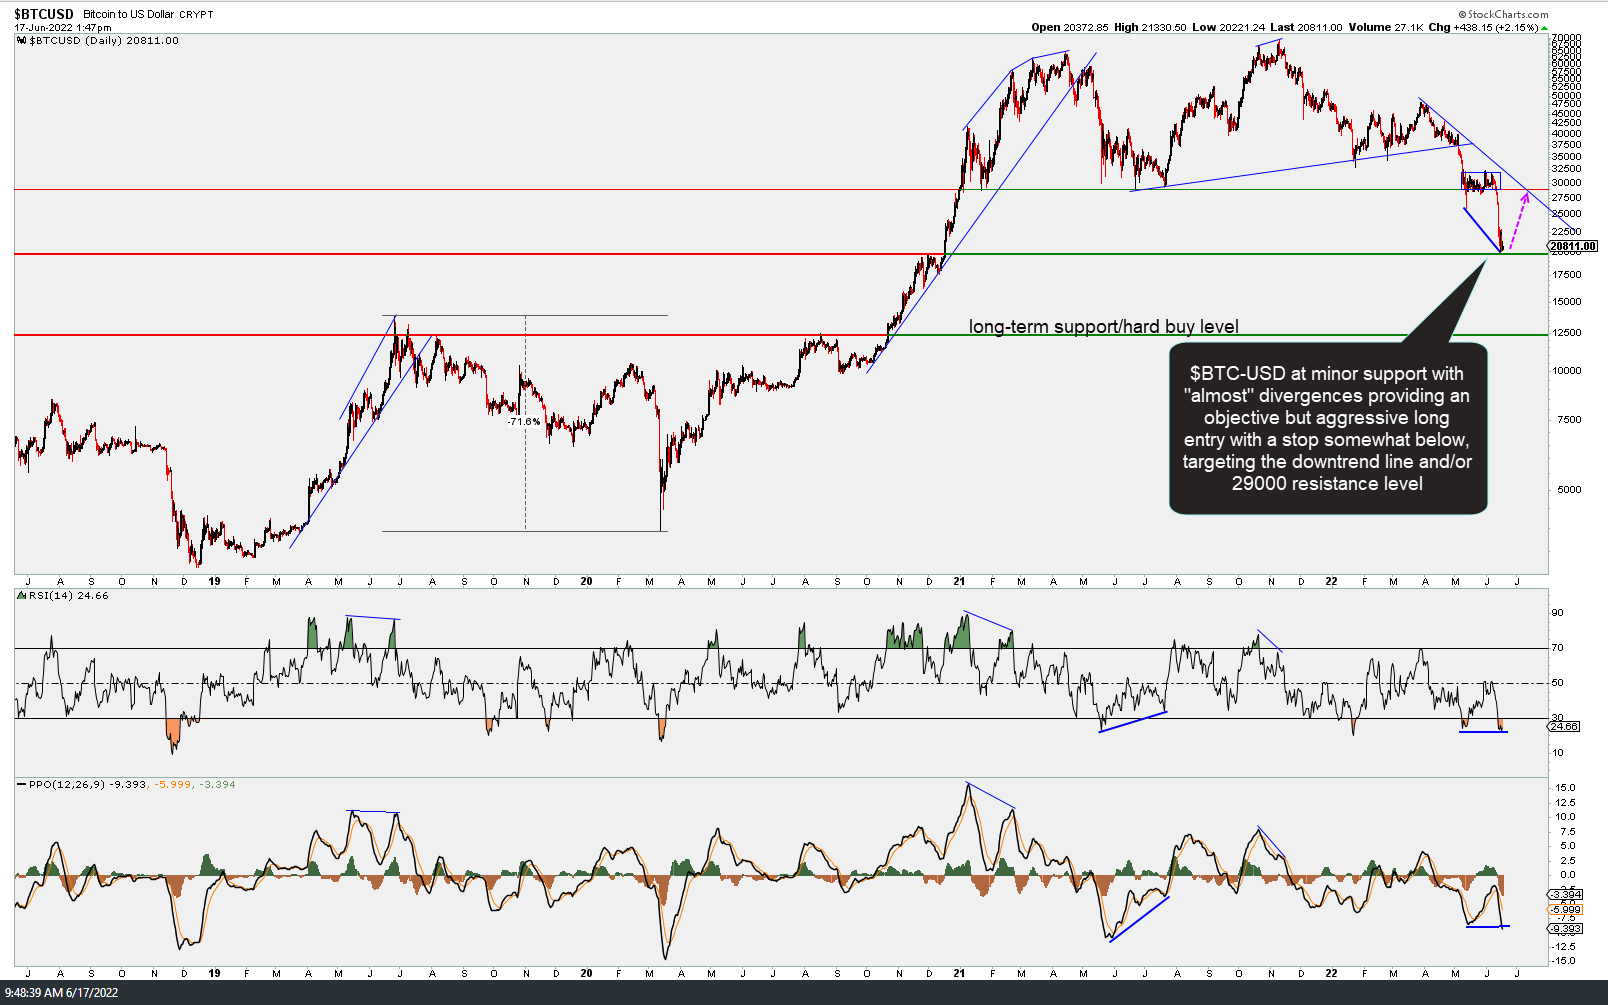
$BTC-USD June 17th
The next chart below is GBTC (Bitcoin Trust), an ETF-type instrument that tracks the price of Bitcoin but may trade at a premium or discount to the actual price. GBTC has also fallen to moderate support around 12.60 with an “ADL”. Should it reverse from around current levels with the stock market doing the same, my price targets would be the bottom of the big June 13th gap down, followed by 17.00, 17.93, and/or the downtrend line just above (that will probably come in with one of those targets if/when GBTC gets there).
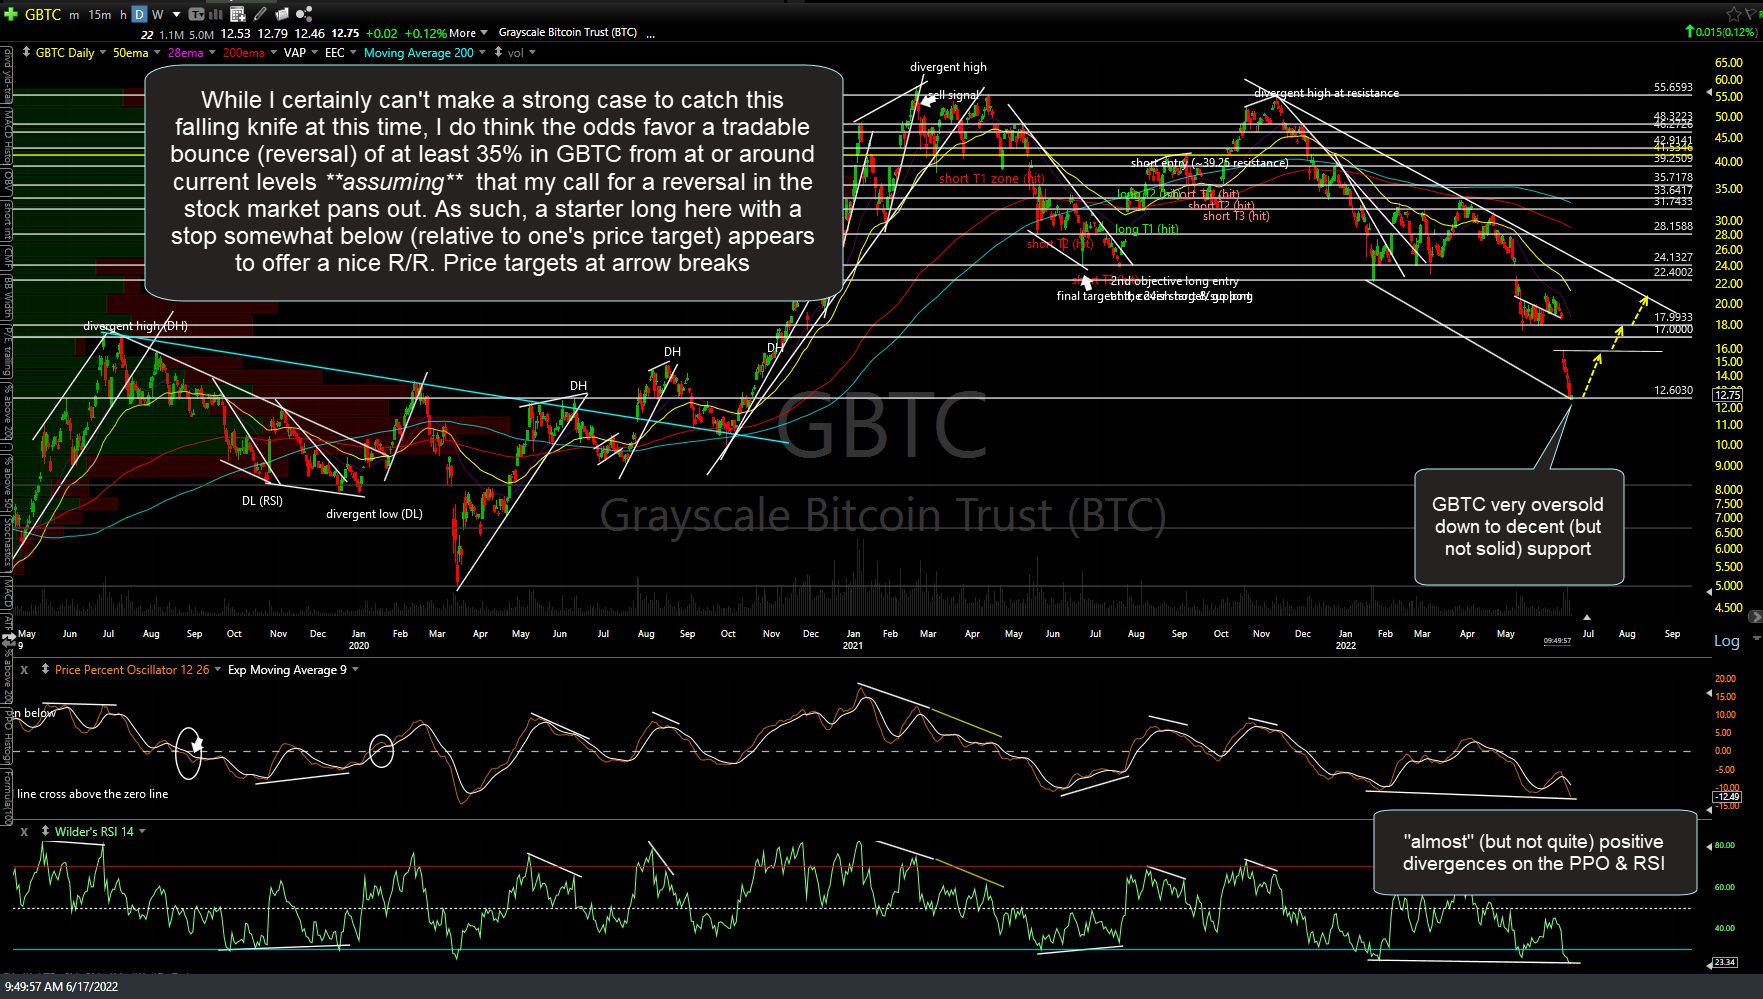
GBTC daily June 17th
The final chart below is a 3-month hourly chart of /BRR (Bitcoin futures). Again, I can’t make a strong case to step in just yet, at least not anything more than an aggressive starter position, but if /BRR can breakout above the 22830 resistance level (and the stock market is in rally mode at the time) that would likely trigger a strong rally in /BRR back up to the 28575 level and/or downtrend line just above.

BRR daily June 17th
Keep in mind that as I type, /NQ has once again been smacked down hard (rejected) off the 11,300ish key resistance level that it needs to take out in order to make a run at the next big resistance level of 11535. As such, one might want to wait for /NQ and QQQ to at least take out today’s earlier highs (i.e.- a breakout above /NQ ~11,300 & QQQ ~276) before starting a position in Bitcoin as a failure for the Q’s to do so increasing the odds of another leg down in the stock market (and Bitcoin) to my next & final “initial bear market” swing/trend targets.