
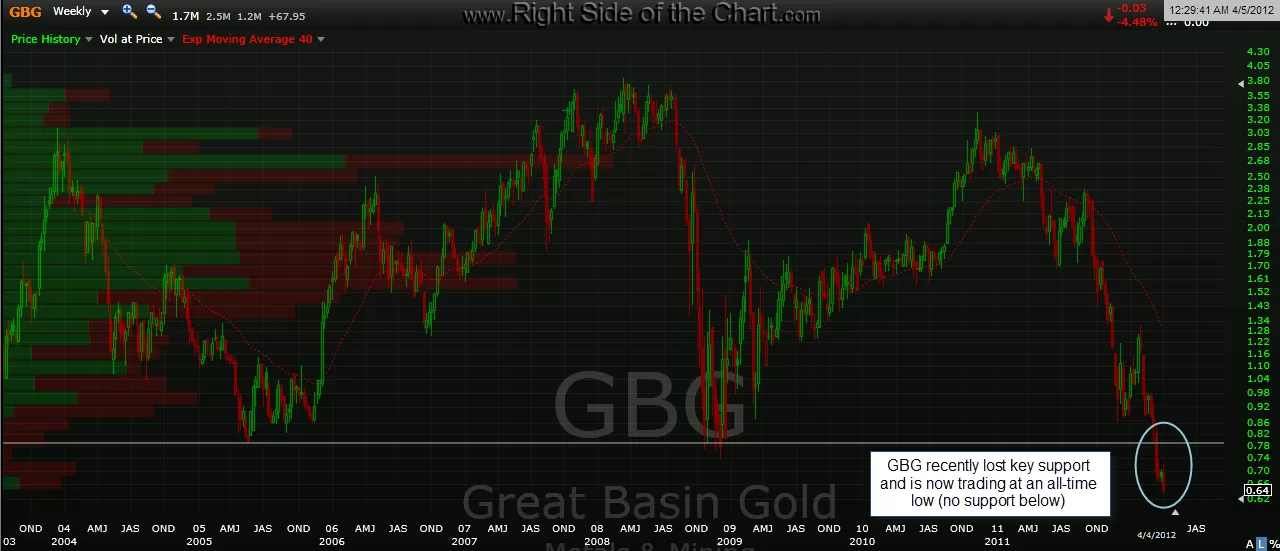
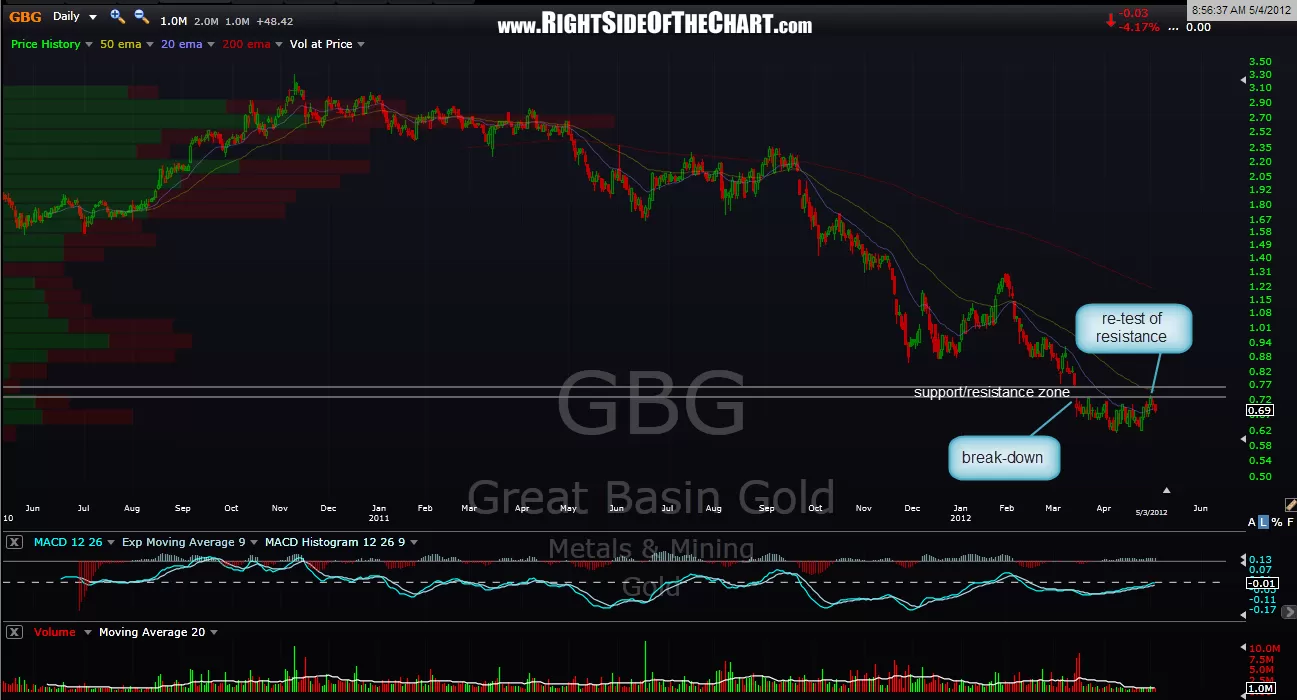
second chart above is the updated GBG daily chart showing the break below support and subsequent re-test while the first chart is the original weekly chart. until/unless GBG can make a sustained move back up above that level, this is a very bearish break-down from a technical perspective as per my original notes on the trade. targets TBD but consider stops not too far above that resistance zone, preferably on a closing basis.
remember, you can always view previous posts & charts on a trade by either clicking on the blue symbol at the bottom of the post or use the “Posts by Symbol” drop-down box on the right of the page. This method will display all posts on that symbol starting with the most recent. You can also go into a specific trade category (set-ups, active trade, etc..) an by clicking on the symbol in the list at the top of the page, only the recent string of posts related to that current trade will be displayed (vs. past trades on that stock or etf).