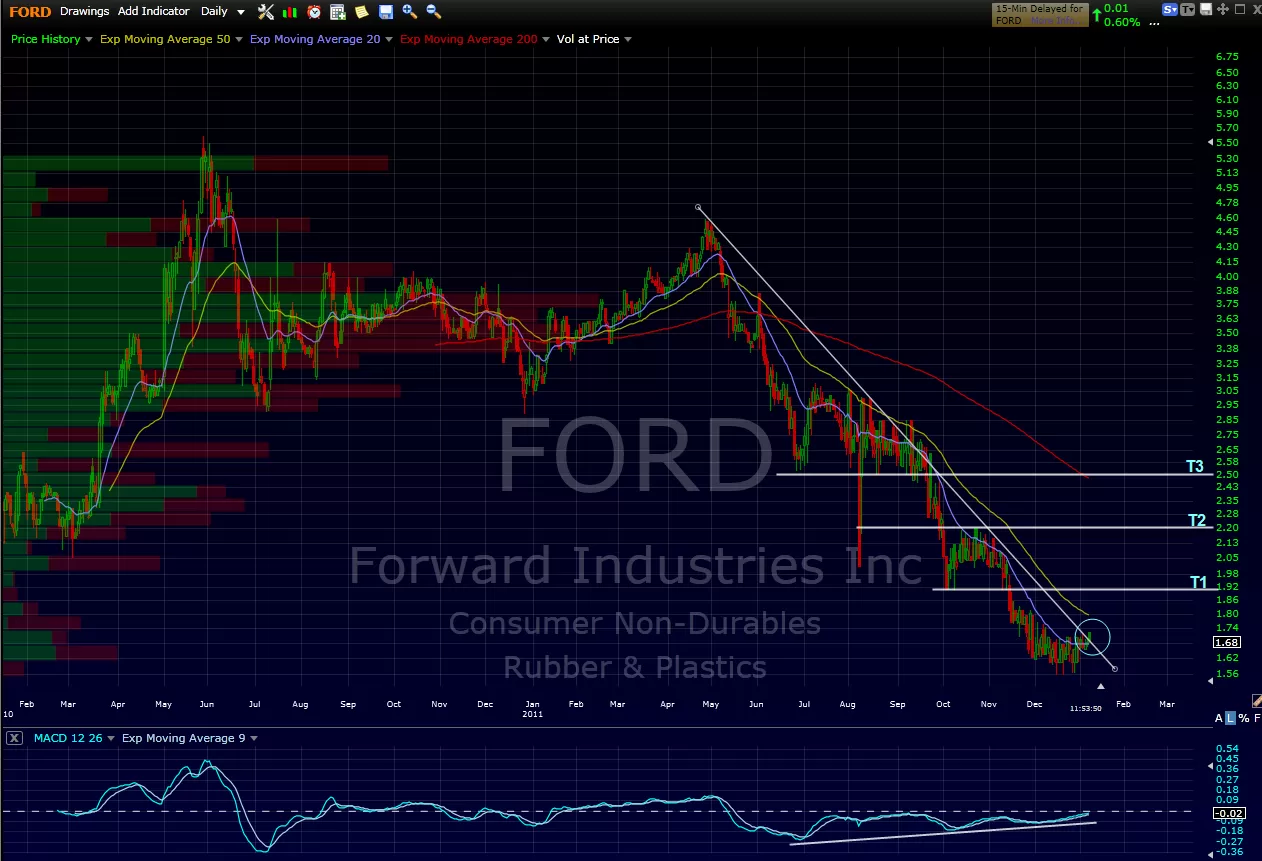
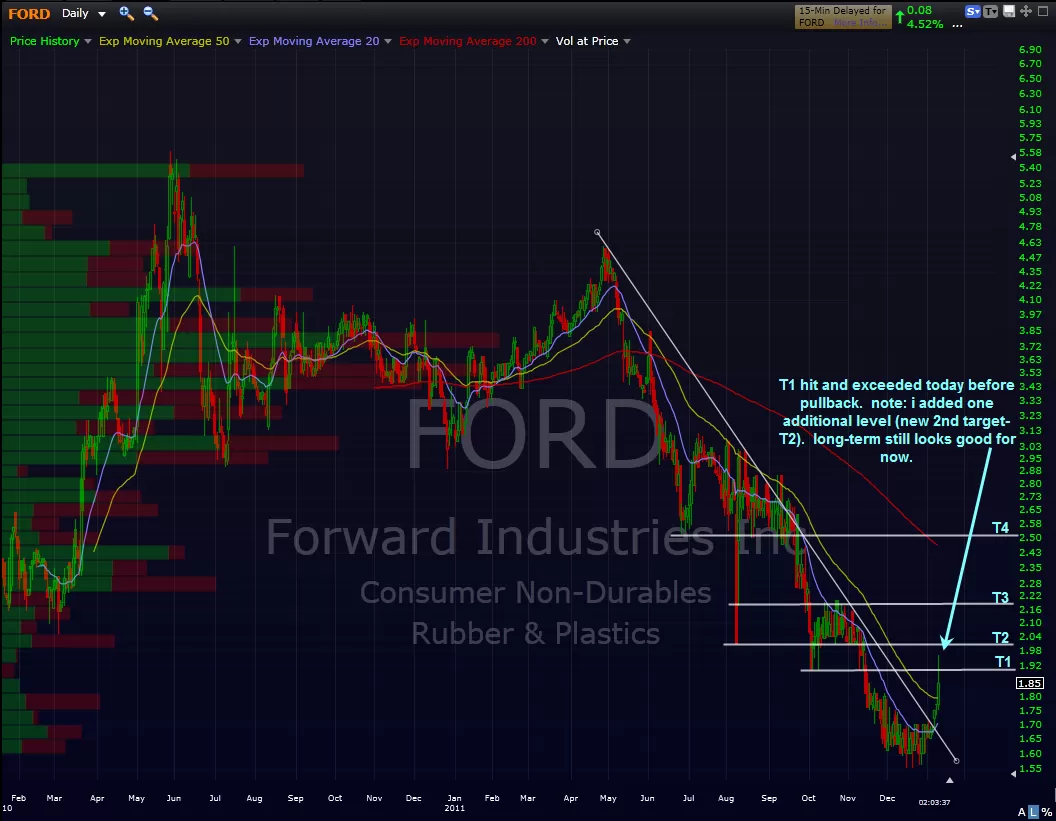
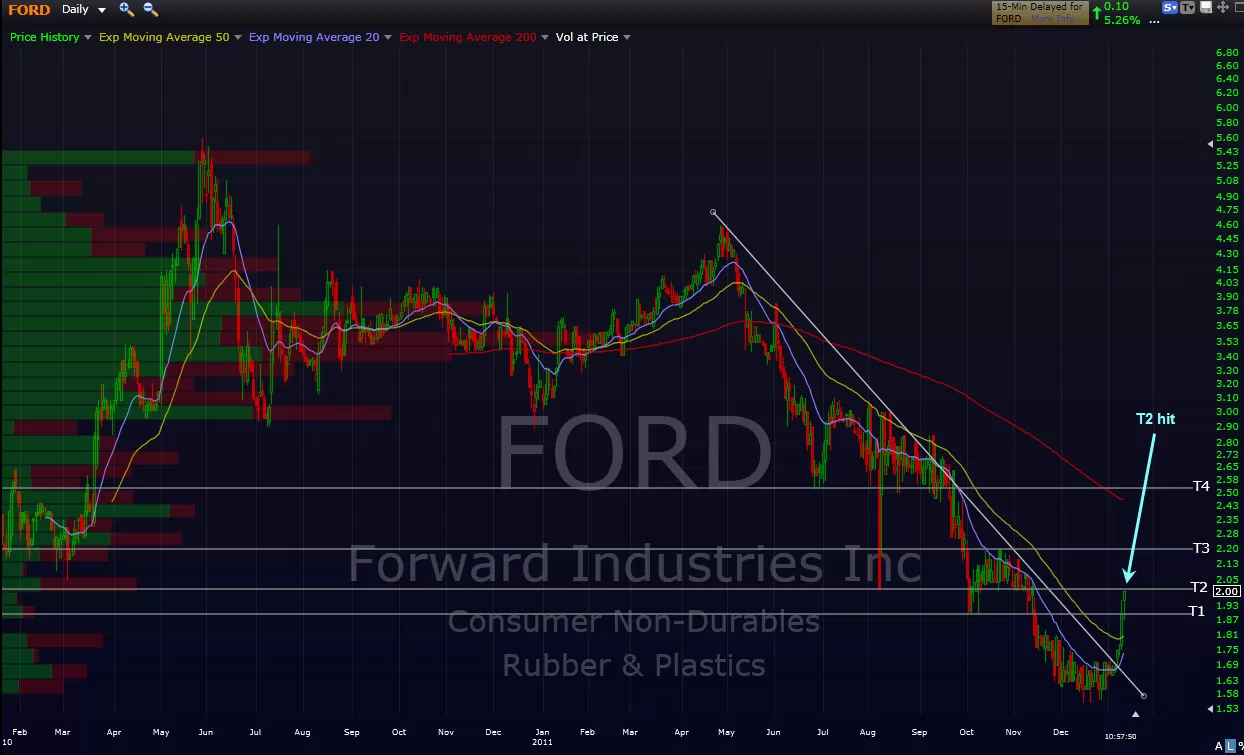
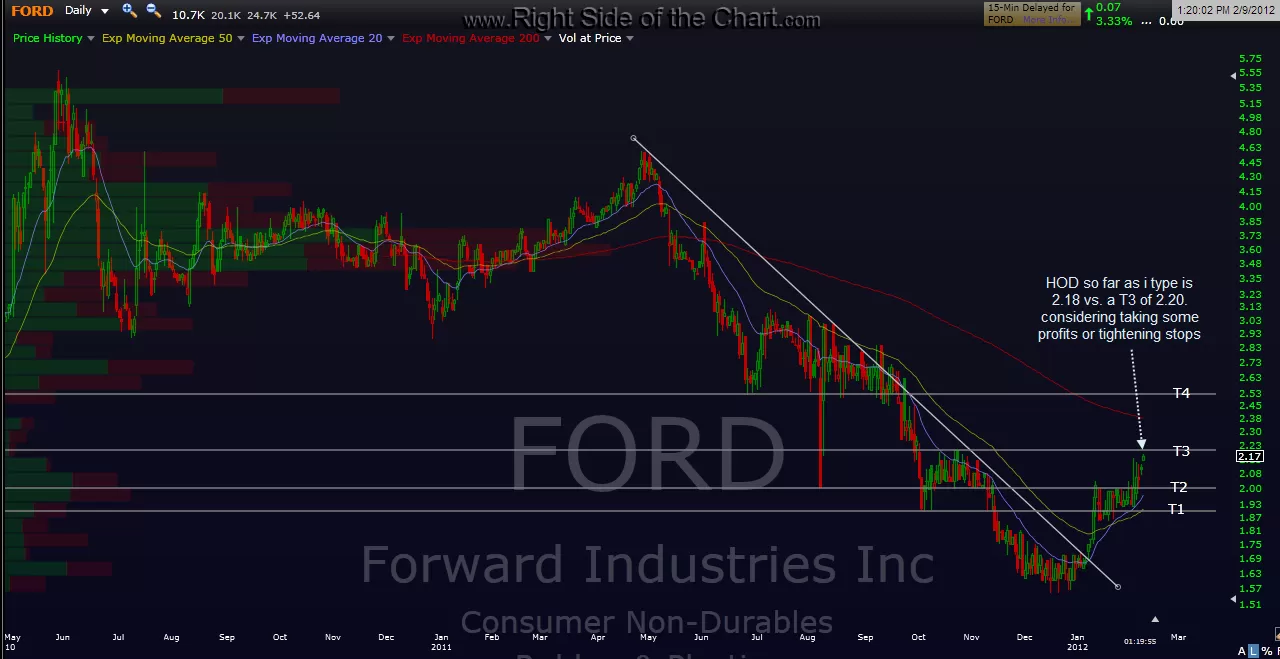
actually FORD just hit 2.18 vs. my 3rd target of 2.20 and as i often say, i like to sell just shy of resistance to assure a fill. this is actually one of my last remaining longs and i am selling all shares here. like so many of the longs posted here in the last month or so, the FORD chart looks to me to have more upside if/as the market moves higher from here so any longer-term swing traders or investors who took it, you can decided whether to take some profits or just raise your stops. this one was first posted at 1.68 (all charts in chronological order as posted below) so that’s about a 30% profit so far, although i will say that since we did get that nice consolidation period between T1 and T2, that very well could provide the fuel needed for a quick run up to T4 from here. again, all (most) ships are lifted in a rising tide and vice-versa so just make sure to keep an eye on those 60 min index charts posted earlier as well as that $NAAD trendline from last night and various other potential trend reversal signals that you might use. click here for the original post on FORD.