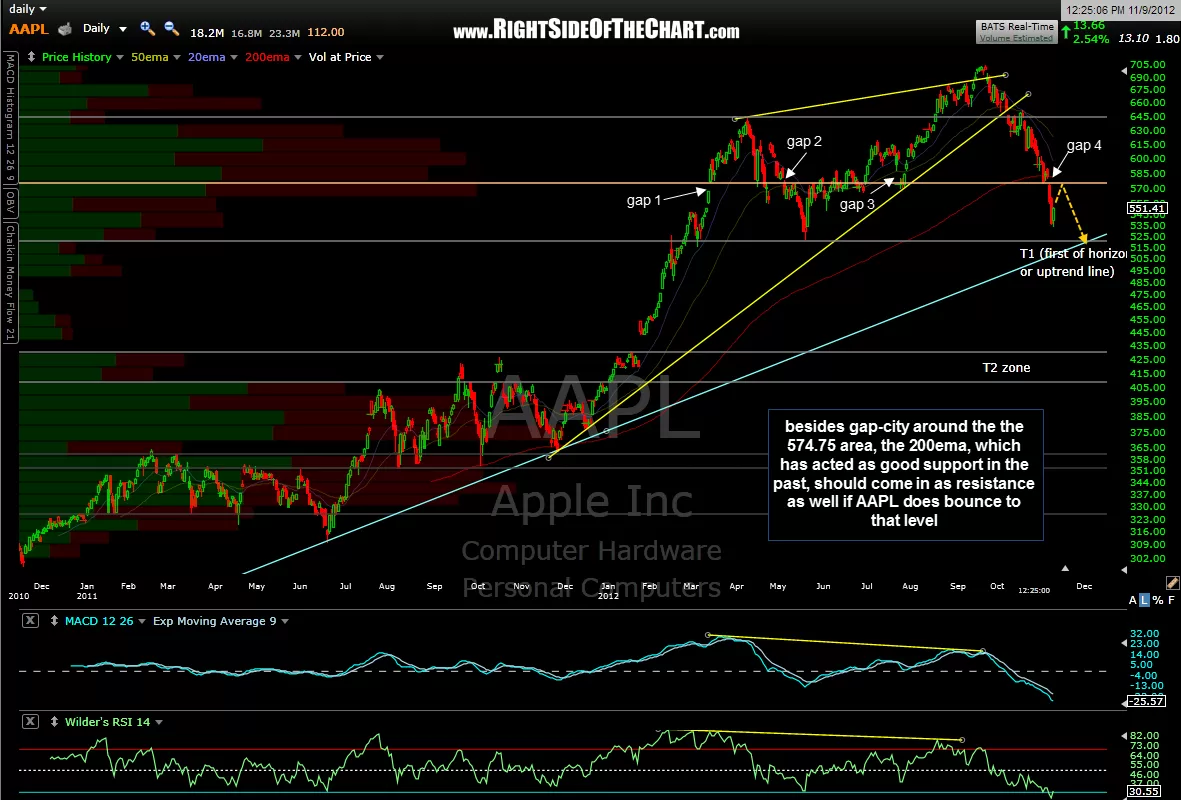
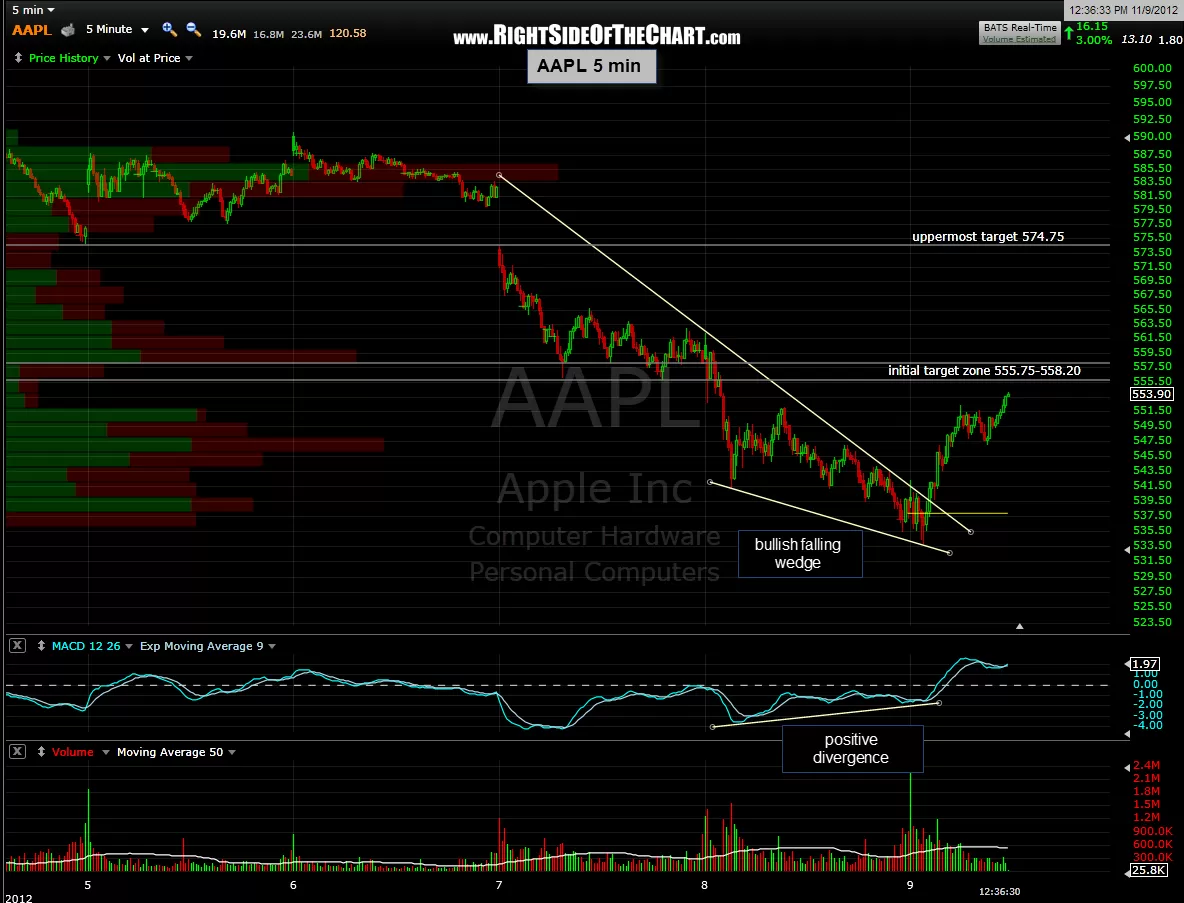
In trying to determine how far this market bounce will go, it helps to follow the leader. This 5 minute chart of AAPL shows a nearly identical bullish falling wedge pattern to the one that I showed earlier on the QQQ (not a surprise with AAPL so top heavy in the Q’s) and I have listed both my initial target zone as well as an uppermost target that would actually play out very nicely when I zoom back out to the daily chart. As you can see below, my uppermost target is at the 574.75 area. Coincidentally (or not), AAPL has multiple recent gaps around that level on the daily chart. Add to that, the 200ema has done a good job of acting as support on AAPL for at leas the last couple of years and that key MA is starting to turn down and should come in at right around the 574.75 level if prices were to move there within the next few sessions. In fact, I may even decide to take my QQQ longs home over the weekend, depending on how the rest of the day unfolds.

Results for {phrase} ({results_count} of {results_count_total})
Displaying {results_count} results of {results_count_total}