
As I was away from my desk earlier today, I’m just now able to share the follow-up to the GDP chart posted in Monday’s Technical vs. Fundamental Analysis article. The fourth quarter GDP numbers were released this morning and as per Econoday:
Highlights:The fourth quarter GDP number is shockingly low. The economy weakened in the fourth quarter, posting a minus 0.1 percent annualized pace, following a third quarter gain of 3.1 percent. The latest GDP number fell far short of the consensus forecast of 1.0 percent. It was the first GDP decline since 2009.
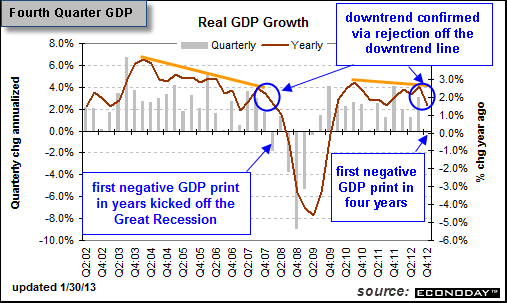 As you can see from the today’s updated GDP chart with my added annotations (below) along with the previous GDP chart posted on Monday (above), the downtrend & similarities leading up to the previous recession & cyclical bear market were reaffirmed today with the sharp reversal off the orange downtrend line (similar to the one back in late 2007/early 2008). Today’s negative GDP print was the first decline since Q1 of 2009 and although it was only a slight drop, it was well below expectations and affirms that the US economy contracted during the fourth quarter. The markets initially shrugged off this potentially ominous report, even moving higher shortly after the open, but the selling gradually overwhelmed the buying throughout the day and most major indices closed slightly to modestly lower.
Will today’s print prove to just be an aberration as GDP bounces back into expansion mode next quarter and through 2013? Possible. However, today’s first contraction reading in years as well as the rejection off the downtrend line helps add to the case this already extended bull market and business cycle may be close to an end (or in the case of the business cycle, already peaked in 2011 as recessions are always officially acknowledged/identified well after the fact).