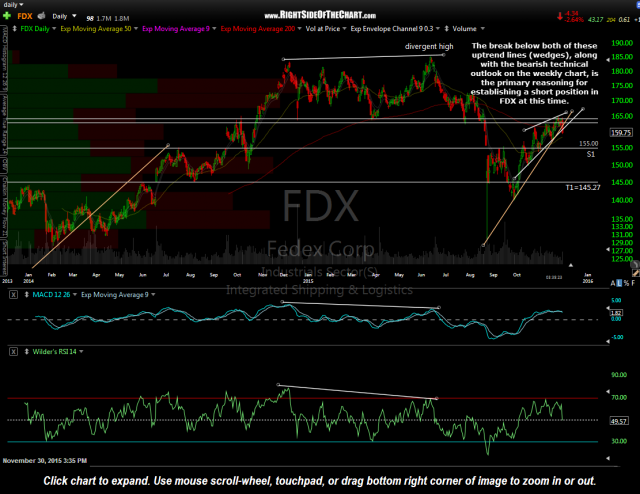
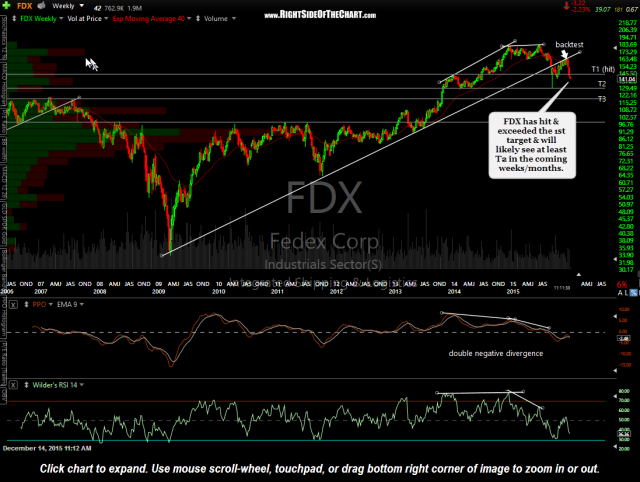
FDX (Fedex Corp) hit the first & sole official price target for a quick 9% gain. FDX was added as an Active Short Trade on Nov 30th following the breakdown below dual uptrend lines. The immediately fell sharply, hitting the T1 level (145.27) on Friday and has now clearly taken out that level with the stock trading down over 12% from entry. Previous & updated daily charts below:
- FDX daily Nov 30th
- FDX daily Dec 14th
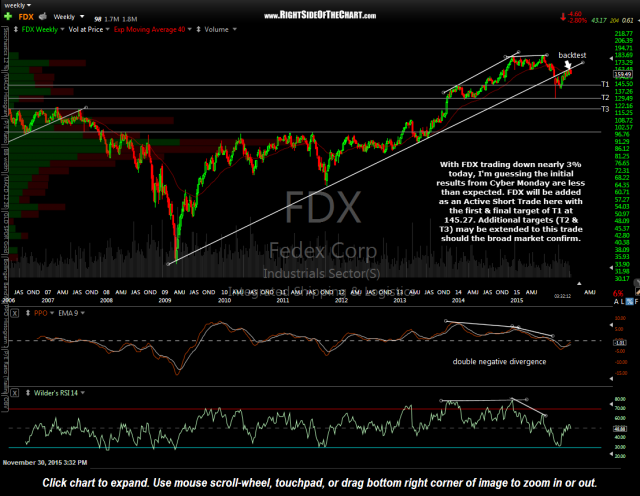
As T1 was the sole official price target for this trade, FDX will be moved to the Completed Trades category. However, as per the original post, especially considering the impulsive nature of the selloff since the breakdown less than 2-weeks ago, FDX is quite likely to reach the 2nd & 3rd price targets that were listed on the weekly chart in that previous post. For those still short & planning to hold out for additional gains, consider lowering your stops at this point to protect profits (a daily close above 146.25 looks ideal). The T2 level comes in around 130.10 with the T3 level around 119.75. Those are the actual support levels, unadjusted for an optimal fill so best to set your buy-to-cover limit orders about 8-10¢ above those levels. Previous & updated weekly charts below:
- FDX weekly Nov 30th
- FDX weekly Dec 14th
On a related note, not only does FDX appear to be headed considerably lower in the coming months but UPS (United Parcel Service) appears to be on the very of breaking down from a Complex Head & Shoulders Topping Pattern. Complex H&S patterns are topping patterns just like normal H&S patterns except they consists of multiple shoulders instead of just one left shoulder & one right shoulder.
It has been pretty apparent to most that Dr. Copper was stripped of its license to forecast the future direction of the economy. However, FedEx & UPS are often used as a forward indicator of economic activity & if these charts continue to play out as expected, it would indicate a significant slowdown in the US & global economy. One has to wonder with oil prices tumbling towards 11-year lows (and crude prices as one of the largest expenses to FDX & UPS), what will happen if & when oil prices start to rise? In other words, without digging into the fundamentals of these two companies, I would have to assume that much of the reasoning FDX is trading about 25% below its June highs is the fact that the market is pricing in future weakness in demand (i.e.- economic activity). JMHO on the fundamental reason for the drop but to see these stocks selling off despite plunging oil prices should raise a yellow flag.


