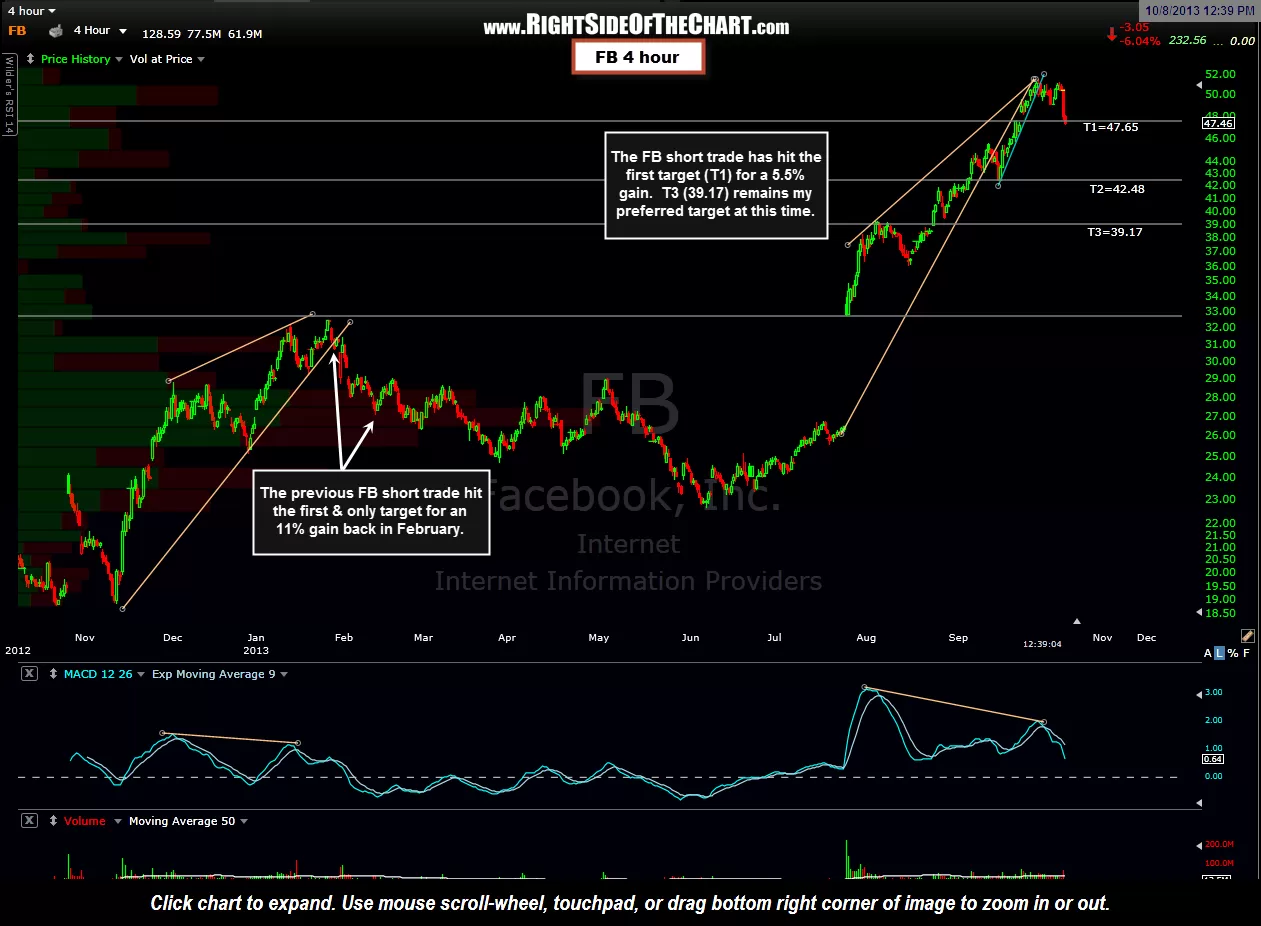
The FB short trade has hit the first target (T1) for a 5.5% gain. T2 remains my preferred target for now but I will likely extend that T3, should today’s breakdown in most US indices stick. Additionally, I may extend the final target on this trade to that horizontal support line at the 32.90ish area, depending on how both FB & the broad markets follow through over the next couple of weeks but for now, T3 remains the final swing target. As aggressive as a 37% drop in FB might sound (assuming that the 32.90 potential T4 level is reached), that would only be just over a 61.8% retracement of the move off the June 6th lows in FB.
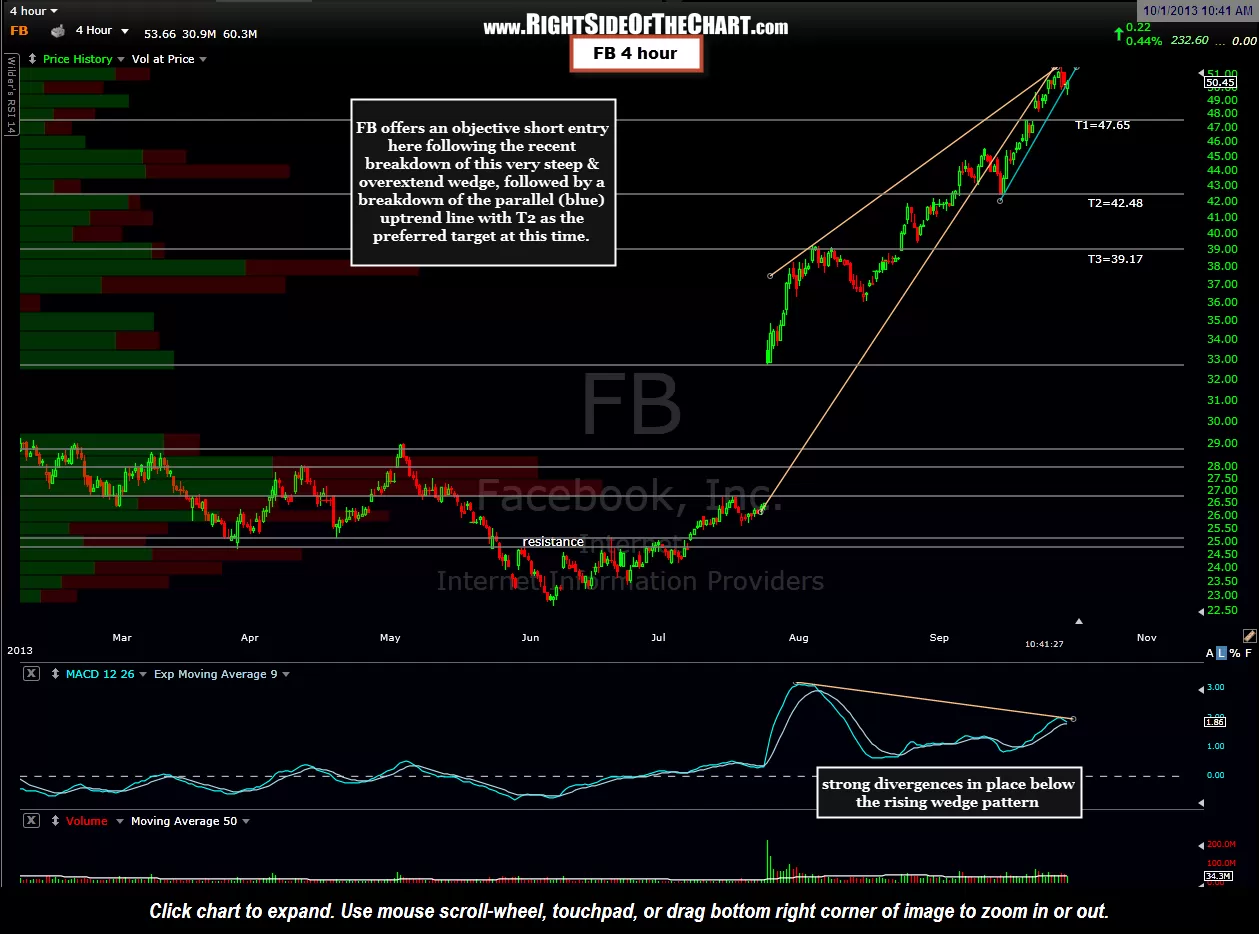
For comparison purposes, following the last FB short trade on RSOTC, which hit the first and final target for an 11% gain back in February, Facebook went on to finish with a retracement of about 70% of the prior move or about a 31% drop in the stock from it’s Jan 28th peak. . That previous trade (in the link above & shown on the updated 4-hour chart below) was also entered following a breakdown and backtest of a similar bearish rising wedge pattern. The primary difference between now & then is that this current rising wedge pattern is much steeper than the previous pattern along with more powerful divergences in place. Therefore, a 37% drop/~61.8% fibonacci retracement in the stock once again is well within my expectations based on the current technical posture of the stock as well as the broad markets. Previous & updated 4-hour charts below:
-

- Oct 1st FB 4-hour chart (entry)
-

- Oct 8th 4-hour FB chart (T1 hit)