
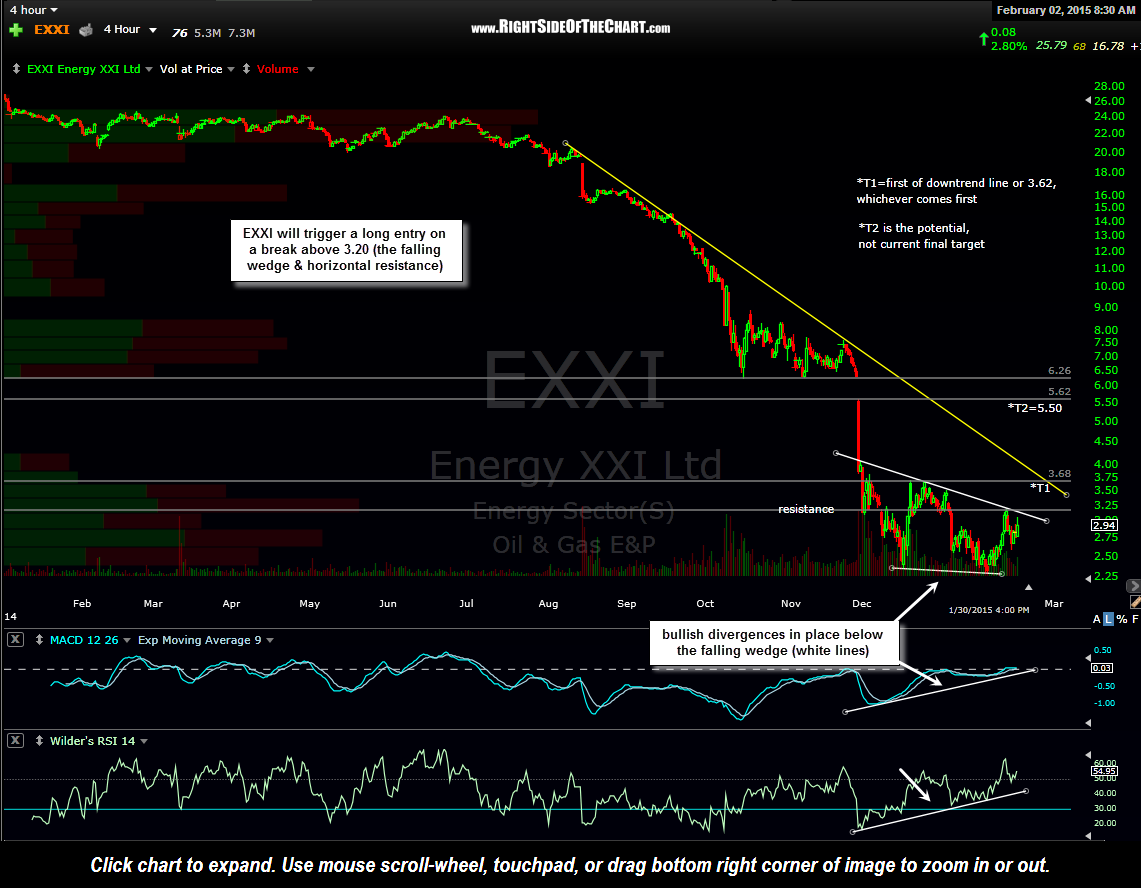
EXXI (Energy XXI Ltd) was just brought to my attention from a follower of the site (thanks M.). Assuming the flush-out/bear-trap scenario on crude oil continues to play out as expected, EXXI looks poised for a move up to at least the 3.68 area, about 25% above where the stock closed Friday. As the 4-hour & 60 minute charts below highlight, EXXI closed slightly below a downtrend line/bullish falling wedge pattern on Friday.
EXXI 4-hour Feb 2nd

EXXI 60-minute Feb 2nd
Although one could certainly use a break above that downtrend line as the trigger for a long entry, the stock also has a slight-to-moderate horizontal resistance level just above the downtrend line which comes in around 3.20. Therefore, the official entry for this trade setup will be on a break above 3.20 with the current price target being the first of the yellow downtrend line shown on the 4-hour chart –or- the 3.62 level, whichever comes first (the actual horizontal resistance comes in at 3.68). EXXI has the potential to morph into a longer-term swing or trend trade with a potential, but not current, target of 5.50 and possibly a move up to the 6.25 area over time. However, that would likely entail a lasting & more powerful trend reversal in crude prices than I am currently expecting. The suggest stop for those targeting T1 with a entry at 3.21 would be on a move back below 3.07.