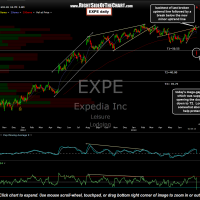
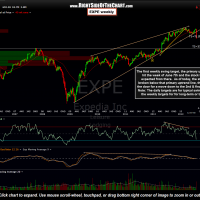
Here are the updated daily & weekly charts of EXPE. For those new to the site, keep in mind that I will often list different targets for the same trade on different time frames. I do this because there are many different trading styles and even I use an eclectic style of trading that adapts to changing market conditions and/or my engagement of the market at time. For example, in a choppy, consolidating market, I might prefer a trading style focused largely on the intraday charts using a very active, short-term trading style targeting relatively shallow, quick profits (aka- hit-n-run). When the market is clearly trending or if I am taking a partial break from the 10+ hours a day sitting in a chart staring at charts, which is essential to prevent trader burnout IMO, I will employ a less active swing trading strategy utilizing larger stop allowances, larger price targets and holding periods typically measure in weeks to months, vs. hours to days.
With that being said, EXPE has been an active short trade since March 21st with targets listed on the weekly chart, for long-term swing and/or trend traders as well as separate targets on the daily chart for the more typical swing traders. EXPE went on to hit the first weekly target for an 11.2% gain on the week of June 7th. That target was the primary uptrend line which makes up the bottom of a large rising wedge pattern. Today prices have clearly broken below that support level which now sharply increases the odds of the 2nd & final weekly target being hit.
Today’s gap also puts us just below the first target (T1) on the daily chart and as long as prices remain below that level, the odds for a move down to the 2nd target (T2 at 40.00) are increased. Note that the final target on the daily chart, T2 at 35.75, is the same as the final target on the weekly chart. Conventional swing traders might consider lowering stops to just above 51 in order to protect profits while longer-term traders might give EXPE a little more room.


