I received an email on the EWJ short trade as the ETF traded as high as 11.86 yesterday vs. my suggested stop of 11.85. Remember, on April 30th, I stated that the stop parameter for that trade would be a on weekly close (end of day Friday) above 11.85 so this trade is still intact for now.
I also wanted to share the fact that although many short trades have been stopped out recently, and rightfully so as the market has had a relentless bid underneath it lately, I still believe that this trade, along with a few other select long and short trades, still have a good chance of playing out. The chart below is the updated 60 minute EWJ chart which shows prices have fallen fairly sharply below the top of the wedge, where they have been skating along for the last couple of weeks. A downside break of the pattern will likely usher in some more selling and as prices are now approaching the apex of the wedge, odds favor this happening sooner than later. I have also added some minor horizontal support levels to this chart for those interested in taking full or partial profits before the 10.90 price target is hit.

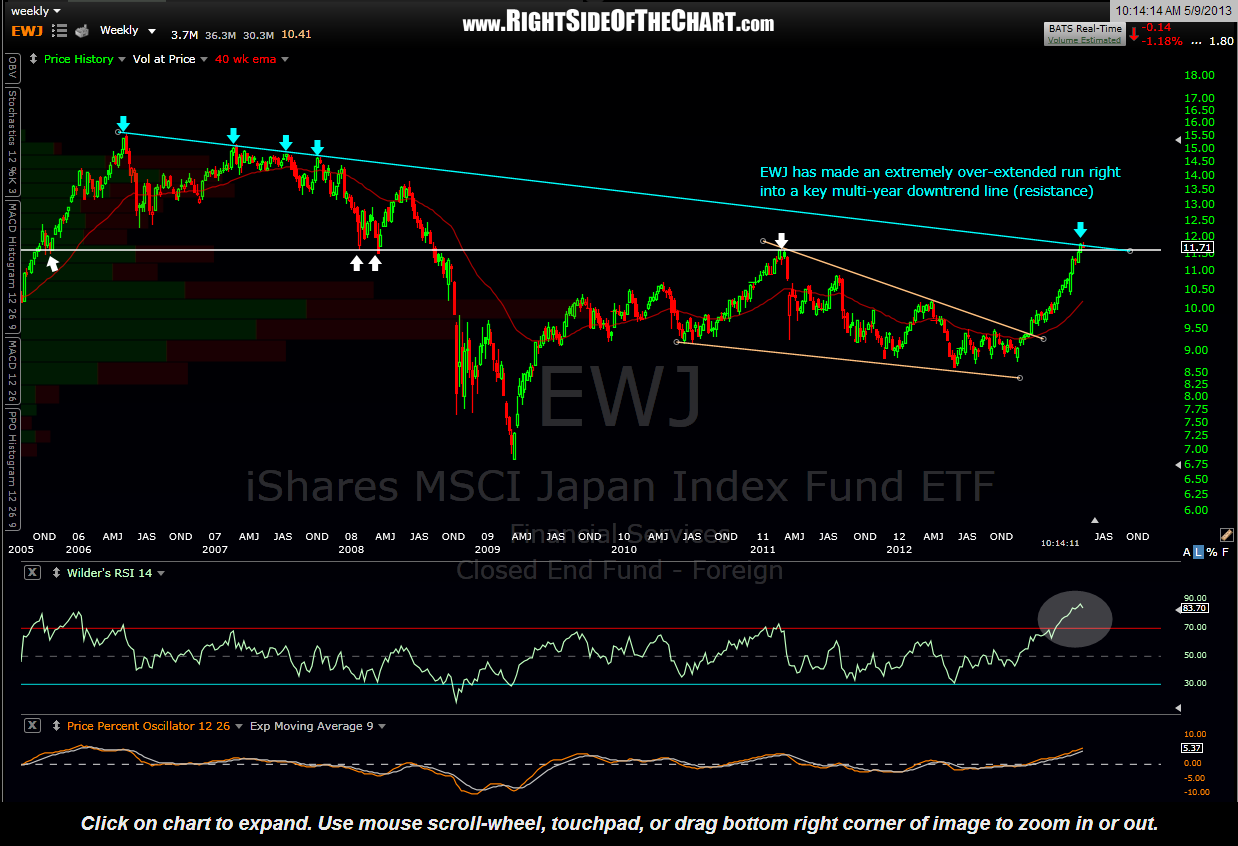
Next is the weekly chart of EWJ showing how prices have made a nearly unprecedented over-extended run right into a key multi-year downtrend line that also comes in around a well defined horizontal resistance level.
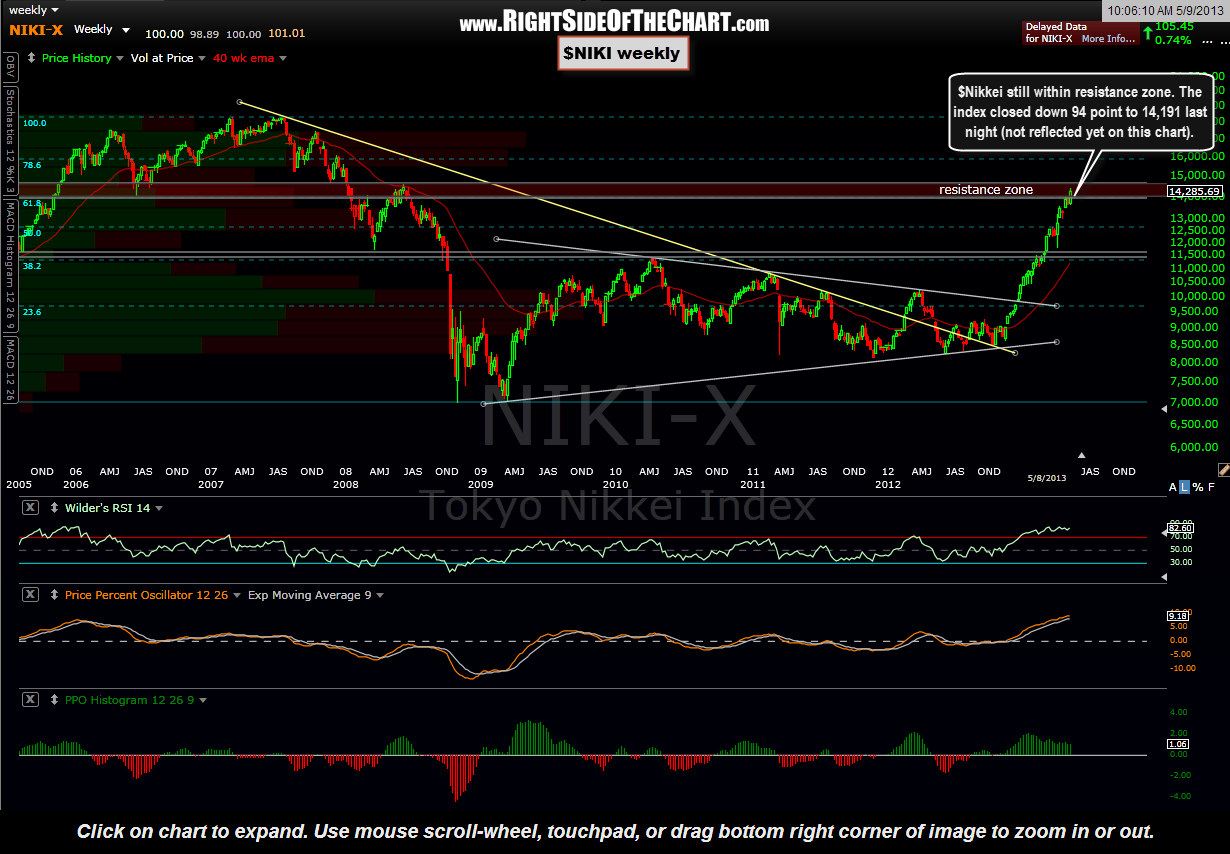
 Finally, the weekly chart of the Tokyo Nikkei Index ($NIKI), which shows prices are still well within the resistance zone, which comes in around the 61.8% retracement level of the previous bear market. Keep in mind that the EWJ does not directly track the $NIKI, rather the MSCI Japan Index. However, birds of a feather flock together so EWJ will roughly mirror any move in the $NIKI and hence, I like to use the EWJ as a proxy for trading the $NIKI or Japanese stocks.