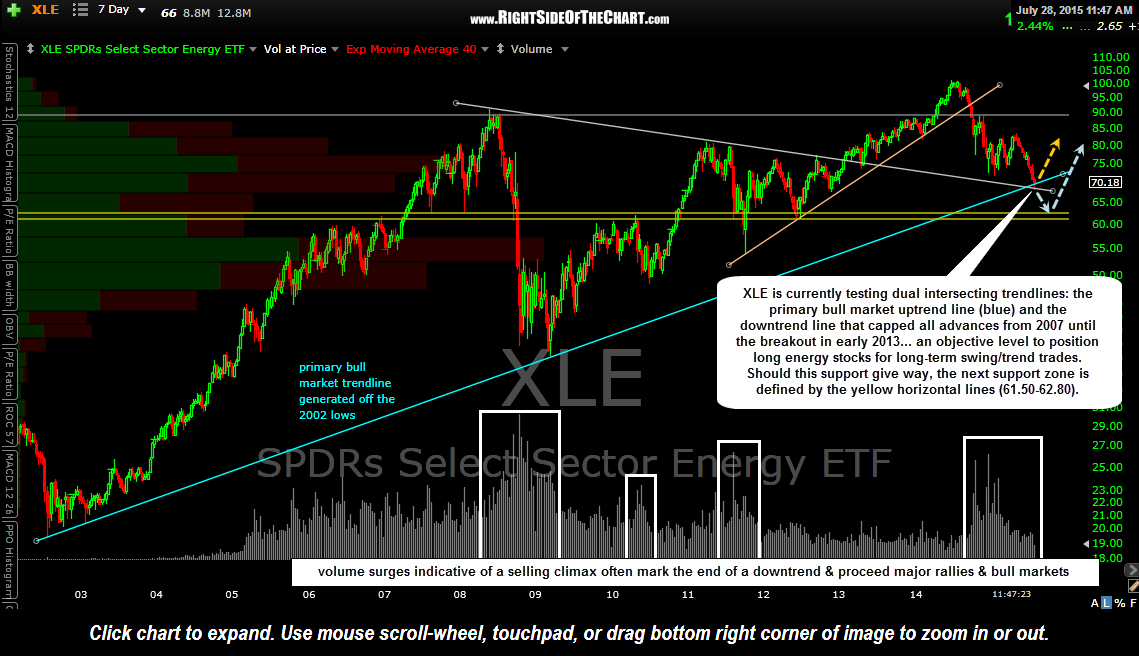
XLE (SPDRs Select Sector Energy ETF) is currently testing dual intersecting trendlines: the primary bull market uptrend line (blue) and the downtrend line that capped all advances from 2007 until the breakout in early 2013… an objective level to position long energy stocks for long-term swing/trend trades. Should this support give way, the next support zone is defined by the yellow horizontal lines (61.50-62.80). This chart is a 7-day period chart (each candlestick represents 7 trading sessions) spanning just over 13 years.
Several key energy stocks are also currently trading at or near key support levels. Although a break of this support can’t be ruled out, establishing long positions in XLE or select energy stocks here with the appropriate stops in place below could prove to be a timely entry for longer-term traders & investors looking to add some exposure to the energy sector. I currently see a mixed bag in the charts with some key energy stocks poised to move higher while I can make a nearly equal case for additional downside in many of these stocks in the coming months but overall, I am cautiously bullish on the energy sector at this time. With the aforementioned support zone only about 8-10% below current levels, longer-term traders & investors might consider initiating a scale-in strategy, starting to buy incremental lots of either XLE and/or the most attractive stocks in the energy sector.
As with gold, to help support the case that a lasting bottom in the energy sector is near, we need to see some technical evidence that at least a tradeable bottom is forming in both crude as well as the energy stocks. So far, one potentially bullish development is the recent surge in volume highlighted on this chart. Such volume surges during a downtrend my be indicative of a selling climax & are often followed by lasting rallies and/or bull markets. In addition to a video, I will post some static charts on some of the more promising setups in the sector asap.


