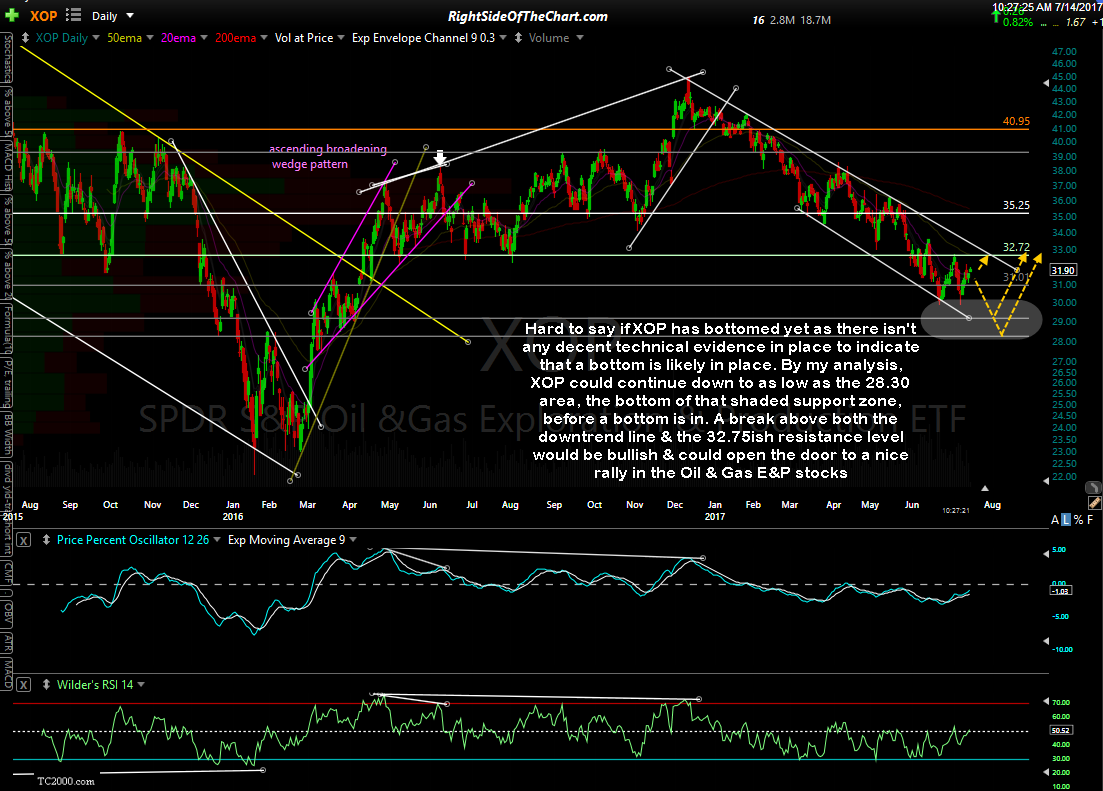
Member @murphydoc inquired within the trading room if it appears that the Oil & Gas Exploration & Production stocks (ETFs: XOP, GUSH, DRIP) have bottomed. Hard to say if XOP has bottomed yet as there isn’t any decent technical evidence in place to indicate that a bottom is likely in place. By my analysis, XOP could continue down to as low as the 28.30 area, the bottom of that shaded support zone, before a bottom is in. Maybe, maybe not. However, a break above both the downtrend line & the 32.75ish resistance level would be bullish & could open the door to a nice rally in the Oil & Gas E&P stocks.
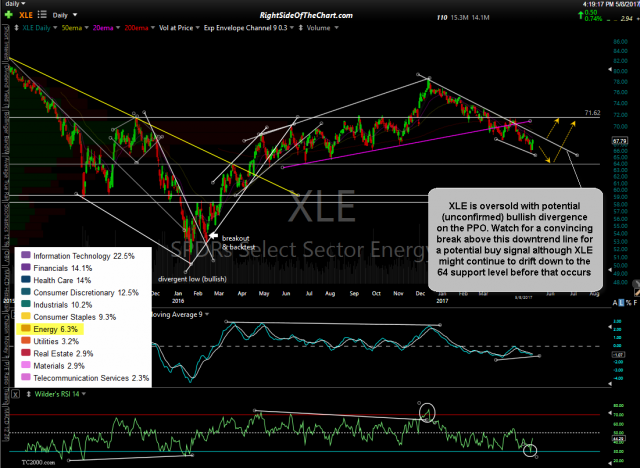
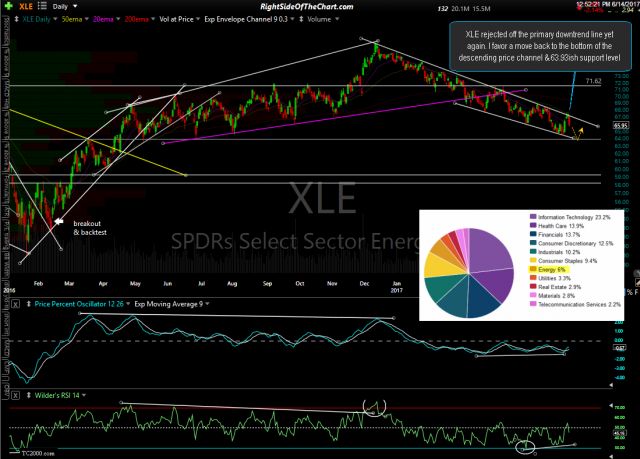
On a closely related note, XLE (Energy Sector ETF), which has a fair amount of overlapping stocks with XOP, is making another run at the top of the descending price channel that I’ve been highlighting for months now. Going back to May 8th (first chart below), I had outlined a scenario that XLE could continue to drift down to the 64ish support level before bottoming & going on to break out above the top of the channel, which would could indicate that the downtrend in the energy sector from the 2016 highs has ended. XLE did go on to fall to the 64 support level, finding support there several times in recent weeks. As such, I remain cautiously bullish on the energy stocks & still maintain that they have one of the best R/R profiles of any of the sectors in the S&P 500, i.e.- minimal downside risk compared to the upside potential in the coming months+.
- XLE daily May 8th
- XLE daily June 14th
- XLE daily July 14th


