
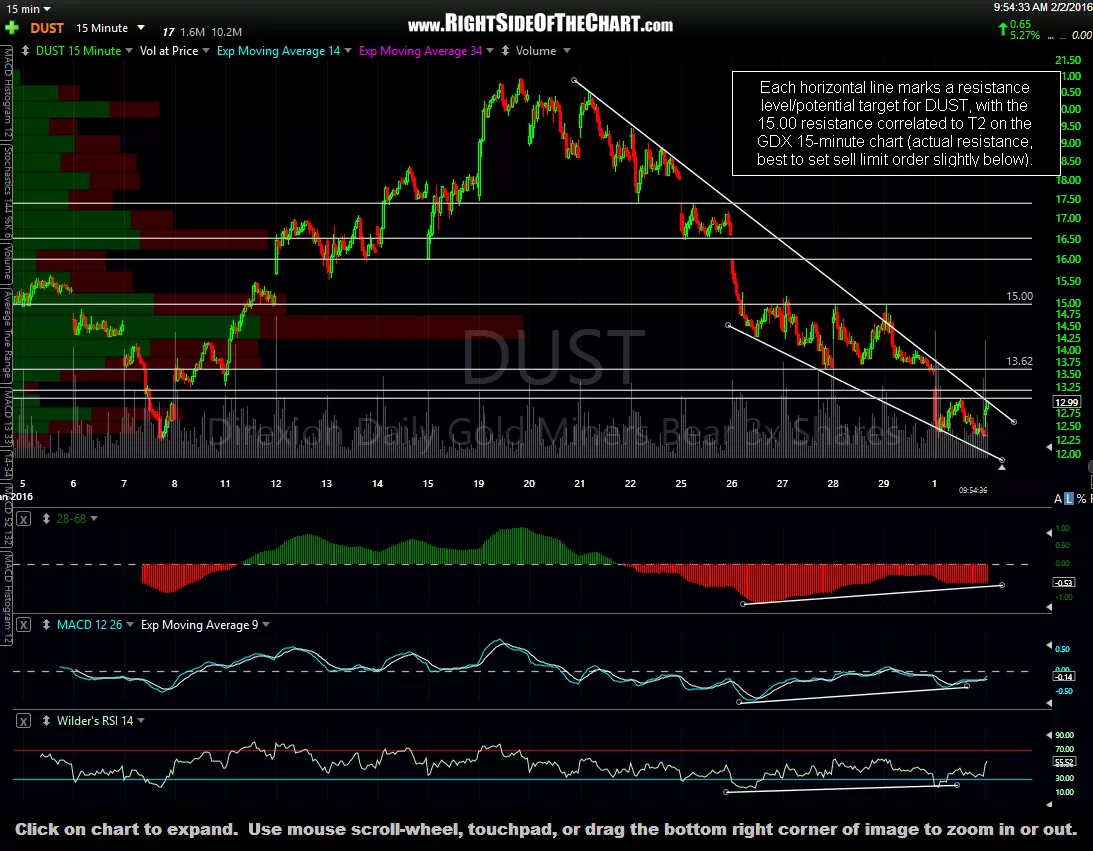
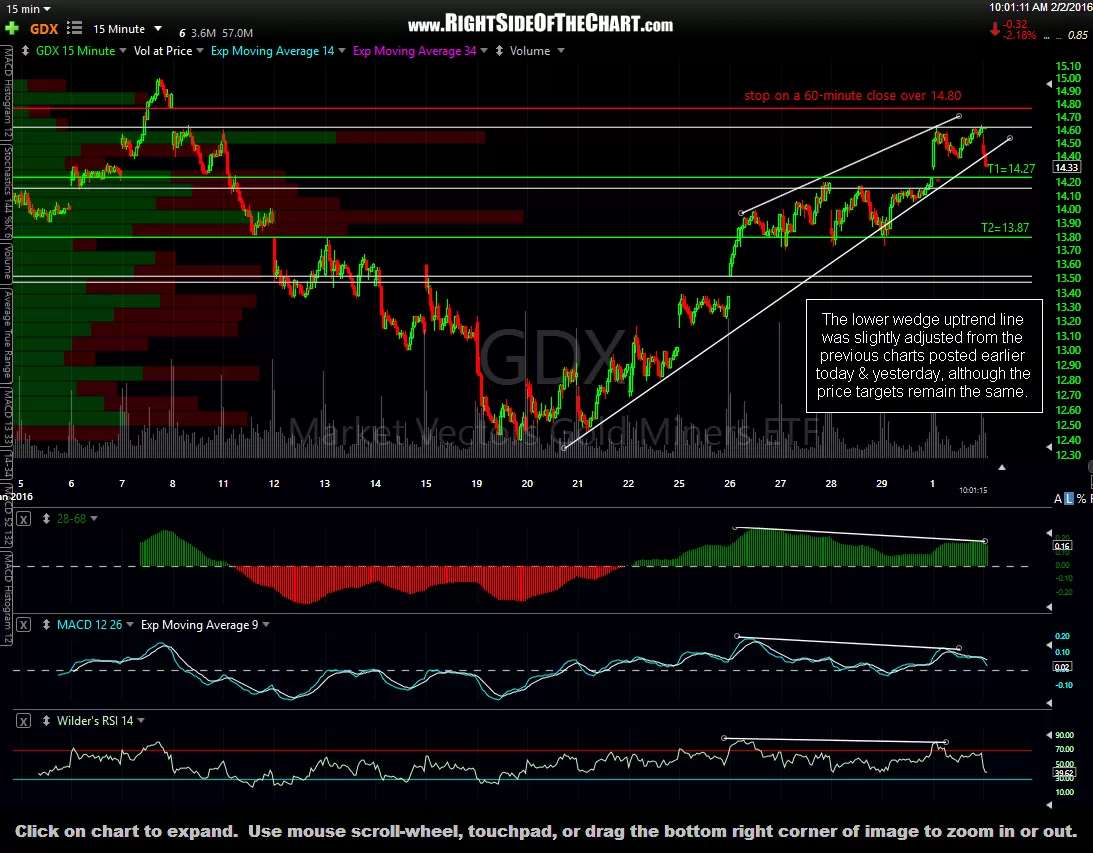
I’ve ever-so-slightly adjusted the lower uptrend line on GDX on this updated 15-minute chart although the price targets remain the same. I’ve also included the updated 15-minute chart of DUST which was posted yesterday under the comment section of the DUST long/GDX short entry post. Below the charts, I’ve cut & pasted my reply to a question regarding this trade, which also applies to many of the leveraged ETF trade ideas posted on RSOTC.
-

- DUST 15-minute Feb 2nd
-

- GDX 15-minute Feb 2nd
Q: Hi Randy, Just to clarify please, you are using the GDX as a model from which to take the DUST trade from? You are not trading both, correct?
A: Technically, I am trading both as I purchased some GDX puts in one account & bought DUST in several other accounts. However, I often use the charts of the 1x (non-leveraged) sector ETFs when trading leveraged ETF in order to time my entries and exits. The reason is that the decay from the leveraged ETFs, especially DUST and NUGT, can be so bad a times that the charts are distorted, even in the short-term, meaning that they don’t represent an accurate picture of where the next support & resistance levels will come in. Hence, I find it better to use the 1x ETF for charting purposes. There’s also the fact that some traders prefer not to use the very volatile leveraged ETFs and might opt to short GDX instead. So yes, GDX is simply a model in which to take the DUST trade from (for determining my entry & exit levels).