
I’ve slightly revised the trendlines that were shown on the recently posted DAVE Long Trade Setup. The yellow lines on the price chart show a bullish falling wedge with the white downtrend line as the top of a descending price channel.
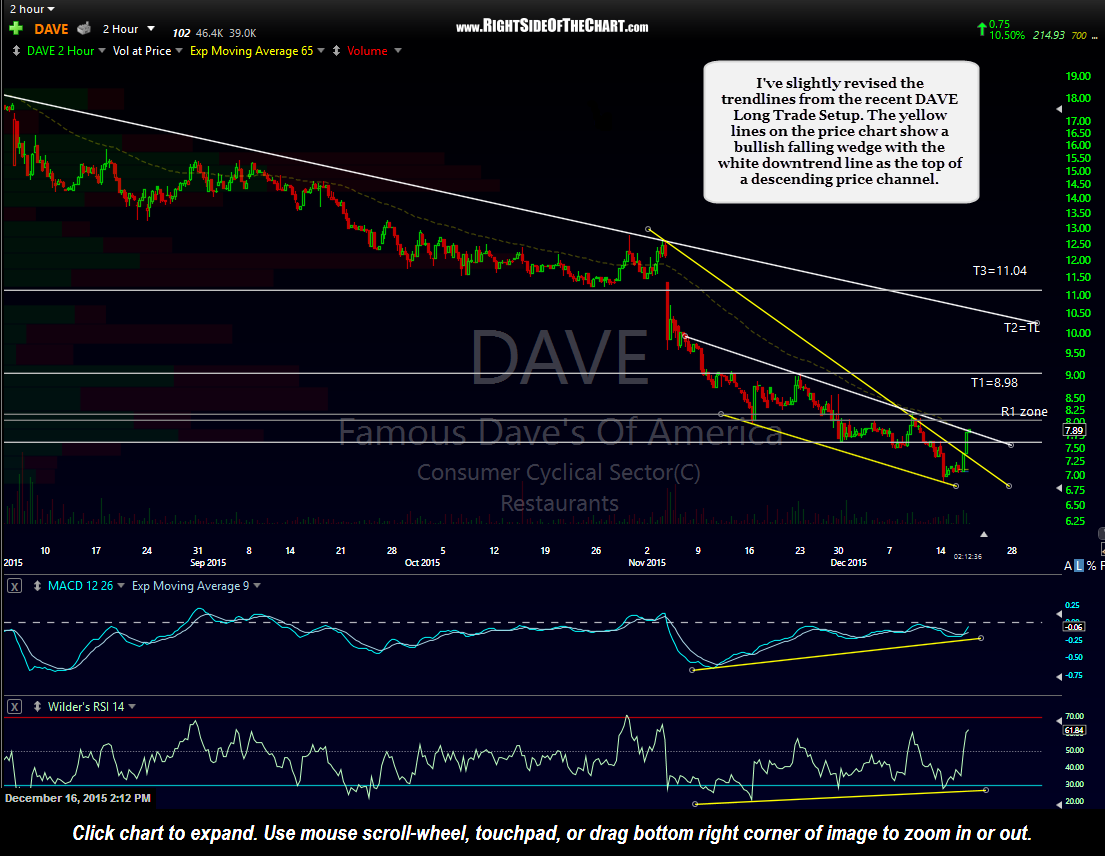
DAVE 120-minute Dec 16th
DAVE (Famous Dave’s of America) remains an aggressive trade setup with the stock in a relentless downtrend but poised for a potential short-squeeze/counter-trend bounce. It appears that DAVE has made an impulsive breakout of the bullish falling wedge pattern (yellow lines) on this 120-minute period chart with the stock up over 9% so far today. The trigger for a long entry will be revised to any move above 7.92 although there is a minor-to-moderate resistance zone not far overhead which runs from about 8.05 to 8.20. As such, one could also wait for that level to be taken out before initiating a new position or adding to a partial position taken on a move over 7.92.
Price targets remain as previously shown (T1–T3) with a suggested stop on any move below 7.50 (or higher, if only targeting T1). Due to the above average gain/loss potential on this volatile stock, a downward beta-adjustment of 50% of one’s average position size is suggested.