
DAVE (Famous Dave’s of America) will trigger a long entry on any break above 12.75, which will have taken the stock over that purple minor downtrend line on this 120-minute period chart. R1 & R2 are the first key resistance levels where active traders might opt to book quick profits while the official (swing trade) targets for this trade are T1 at 15.35 & T2 at 16.95. Suggested stop on a daily close below 11.70.
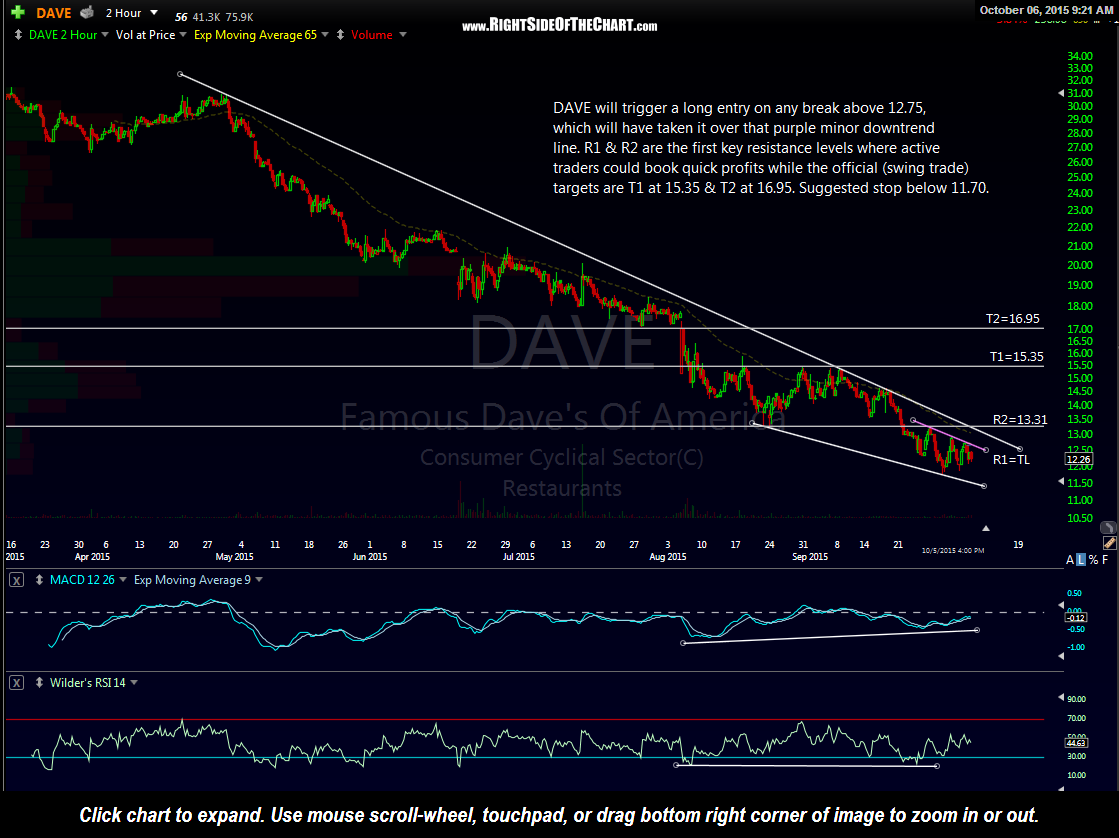
DAVE 120-minute Oct 6th
This 2-year daily chart helps to support the case for a likely trend reversal in DAVE from at or near current levels. The daily chart shows the same bullish falling wedge pattern as the 2-hour chart above although it provides a much better visual of just how steep & deep the decline in DAVE has been, with the stock plunging over 66% since the double-top peak high back in mid-February of this year. That double-top high (potential bearish development #1) was followed by a breakdown below the 2 ½ year primary bull market uptrend line in early May (bearish development #2) with the stock continuing lower to break below the base of the double-top pattern (bearish technical event #3) a few weeks later. Typically, the steeper the wedge, the more explosive the reversal once the stock finally breaks out above the wedge pattern.
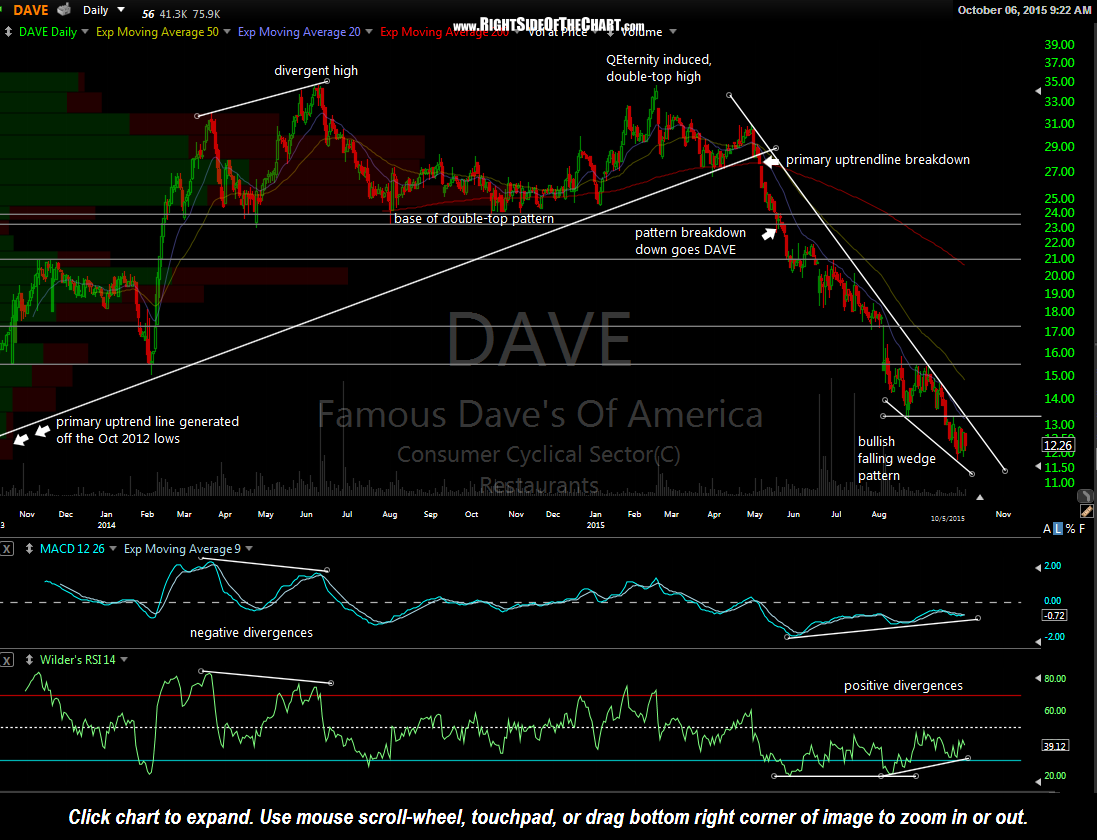
DAVE daily October 6th
Fast-forward to today and we now have a stock that has given up 2/3rds of its value while trading at long-term support (highlighted on the 10-year weekly chart below) in what appears to be a fully developed bullish falling wedge pattern. All we need now is a match to light this fire and although the “safe” or conventional entry will come on a break above the top of the wedge pattern (i.e.- the primary downtrend line), the fact that DAVE is current trading at long-term support make an entry at current levels and/or above the minor downtrend line on that 120-minute chart.
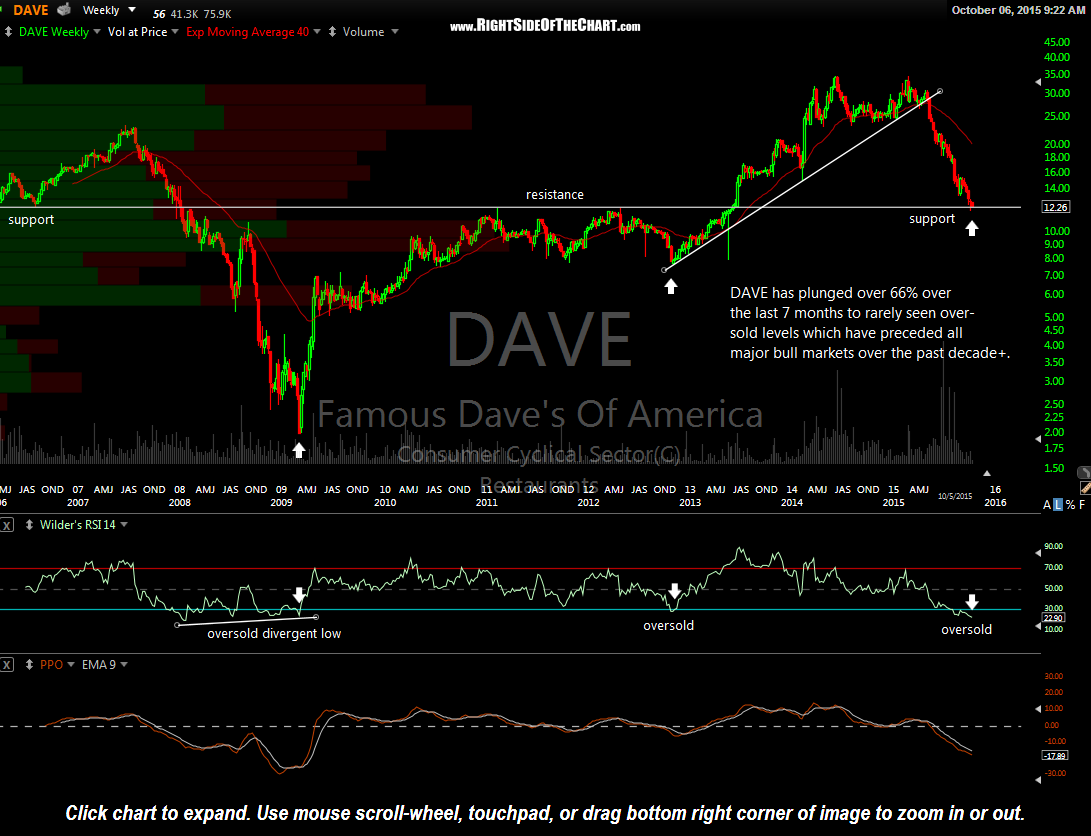
DAVE weekly Oct 6th